Gold’s Shooting Star and Its Implications

After three weeks of declines, gold finally moved higher last week. Was this move surprising? Not at all, if you read our analysis of the previous week’s huge decline in platinum. The sizable slide in the latter was likely to trigger at least a small rally and that’s what we saw last week. However, gold reversed quite clearly on Friday and shooting star candlesticks, as these sessions are called, are signs of a reversal. Did we see one?
That’s not likely. There are several reasons not to believe the shooting start in gold. Let’s take a look at yellow metal’s chart for details (charts courtesy of http://stockcharts.com).
The reversal is a fact, but it is also a fact that the shooting star candlestick should be confirmed by huge volume. Instead of huge volume, we saw rather average and declining daily volume levels. Consequently, the bearish implications of the candlestick pattern don’t seem to really apply.
We explained the importance of confirmations in theNovember 21 Alert, but – in light of the above - it seems that quoting it might help. Back then we described it with regard to a breakout in silver and its subsequent invalidation, but the explanation regarding volume applies also to reversals.
As we’ve often emphasized, invalidations of breakouts are effective immediately and are quite strong signals that the move in the other direction is about to follow.
If you’ve been wondering why this is the case, here’s an explanation. If the market moves over a given resistance then this move could be accidental or it could be a true show of strength. What we want to see is signs that would confirm that there has been a “battle” for a given breakout and that the bulls have won this battle. A fierce battle means that a lot of capital was used and we would see high volume levels as a confirmation (that’s why a huge volume reading can confirm a breakout or breakdown on its own). But, what if the market was somehow forced to move higher (for instance gold could rally given a big plunge in the USD as the latter would make it cheaper in terms of other currencies and if the demand didn’t change overall, lower prices would attract more buyers), but it really doesn’t want to rally? That’s why we use the 3-day confirmation rule. If the move was artificial in some way, the market participants are likely to push the price in the original direction. Naturally, if the markets that usually confirm each other’s moves all break out or break down at the same time it further increases the odds that the move is true.
However, in the case of invalidations things are different. Invalidations are not just breakouts / breakdowns in the opposite direction. The preceding action is important. Before a breakout/breakdown, the investors and traders know that it would take an effort and a “battle” for the market to move above/below a certain level – the market is therefore before the “battle”. In case of the invalidation, the market is already after (!) the “battle” where the “bullets have already been shot” (trades have been made and capital has been used) and the invalidation shows that the supposedly winning side wasn’t able to hold the new ground even though the price was already above/below the key price level. This immediately (!) means that the entire “battle” was not real or it wasn’t really won as if it were, the winning side would be able to hold its ground. So, any bullish implications that the breakout might have had are invalidated.
But why is this bearish on its own? Because it shows that even though the supposedly winning side had everything in their favor (the price moved above the certain level) it turned out to be weak and the capital that was used to push the market higher can’t be used push it up again as it’s already in the market.
What does it mean for the gold market in this case? That a reversal that was accompanied by average – and declining - volume shouldn’t be trusted.
But maybe it’s some kind of data error?
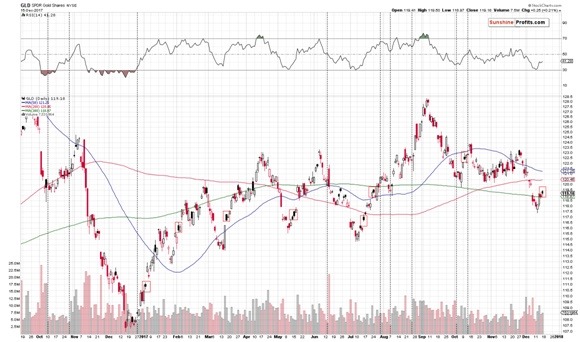
It seems that conclusions can be made based on the above chart. The closing price and the intraday action is consistent with what we can see on the GLD ETF chart.
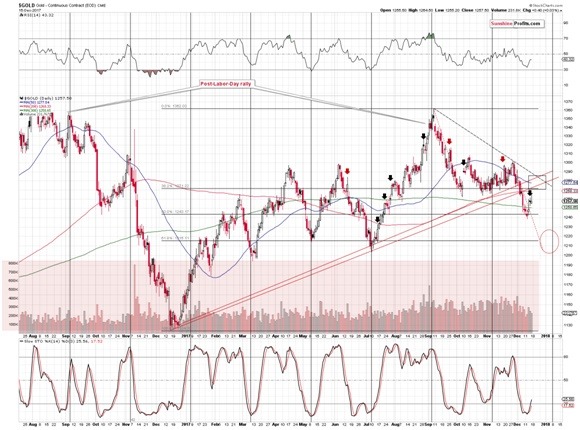
The above chart shows that the price action that we saw on Friday is very similar (red rectangles) to what we saw many times during the early stages of the previous upswings.
While we don’t expect the current rally to be as big as the preceding ones, the above analogy is enough to tell us that we shouldn’t worry about potential bearish implications of Friday’s reversal.
Moving back to the chart featuring gold futures, please note that the Stochastic indicator is not only after a classic buy signal, but also after a visible move back above the 20 level. In all similar cases that are visible on the above chart, similar action meant that the rally was not over yet.
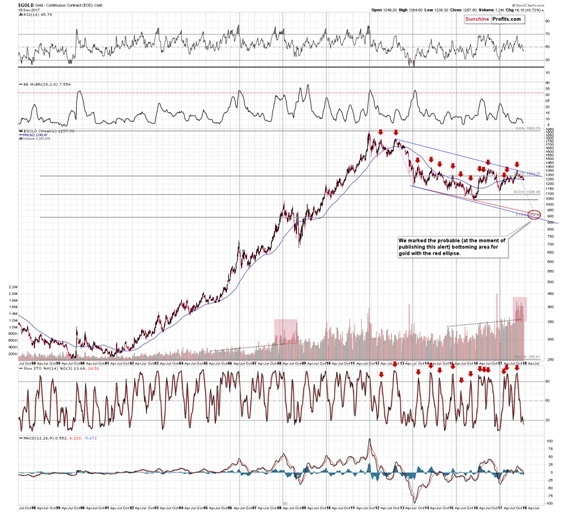
Still, let’s keep the big picture in mind. The rally that we are seeing right now is most likely just a short-term phenomenon, not a game-changer. The medium-term trend remains down and our previous comments on gold’s long-term chart remain up-to-date. When gold closed the week below the 60-week moving average (marked with blue on the above chart), we wrote the following:
The thing that we would additionally like to point out on the above chart is that gold moved to (and closed the week below) the 60-week moving average. It had already moved close to this level in early October, but corrected shortly thereafter. Why do we mention this while discussing the long-term gold chart? Because on the above chart you can see something very similar in late 2012 and early 2013. Back then, gold’s final top was followed by a move to the 60-week MA, then we saw a correction, and then a move below the previous low and the 60-week MA. After that low we saw another corrective upswing that was a bit smaller than the previous one.
The implication here is that we could see even lower gold prices on a very short-term basis, then a correction that would not be very significant and then another big wave down. That’s in tune with what we’ve been expecting to see based on other factors, so the above simply serves as a confirmation.
In other words, a corrective upswing here is very much in tune with what took place about 5 years ago and the implications are bullish for the short-term but very bearish for the medium term.
Summing up, the medium-term outlook for the precious metals market didn’t change based on last week’s developments and it remains bearish, but the short-term outlook is bullish. Friday’s reversal in gold was not confirmed by increased volume, so the bearish implications that it should generate are rather insignificant. Conversely, since gold managed to close the session without declining given the USD’s upswing, this action serves as a bullish confirmation.
Want free follow-ups to the above article and details not available to 99%+ investors? Sign up to our free newsletter today!
Author

Przemyslaw Radomski, CFA
Sunshine Profits
Przemyslaw Radomski, CFA (PR) is a precious metals investor and analyst who takes advantage of the emotionality on the markets, and invites you to do the same. His company, Sunshine Profits, publishes analytical software that any


