Gold’s long-term turning point is here

Historical precedents are in many a technician's toolbox – and it's a tool they reach for with success repeatedly. Does the yellow metal offer any interesting parallels?
Gold had declined and it recovered, but the above simply prolongs the 2008-2020 analogy; it doesn’t invalidate it. Today, gold is attempting to break above the previous highs, but it’s not being successful in that.
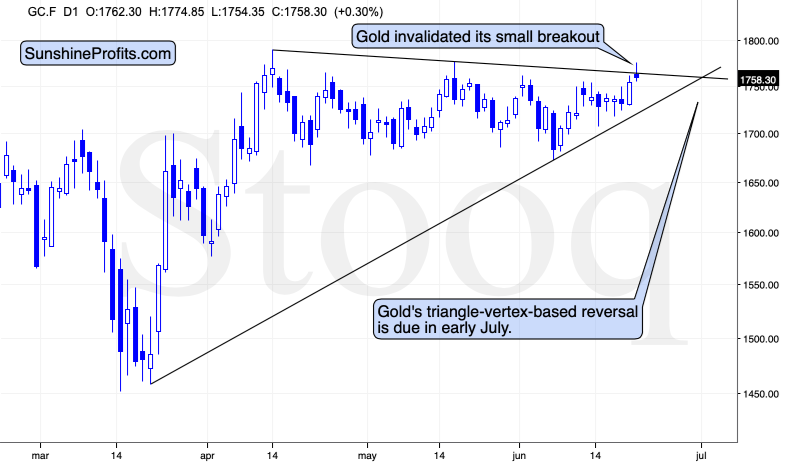
Gold topped about a dollar below the May high and just like it was the case in May, and in April, gold quickly moved down from these levels. Gold futures are at $1,756 at the moment of writing these words, which means that gold invalidated the small breakout above the declining resistance line that’s based on the April and May highs.
This is a bearish sign pointing to the repeat of the pattern – gold is likely to once again decline from the current levels to at least $1,680 or so. The emphasis here goes on “at least” as given the bearish support from the media (spreading the coronavirus fear) and the short-term breakout in the USD Index.
The resistance line, above which gold tried to break and the rising support line based on the March and June lows cross more or less in the first days of July. The triangle-vertex-based reversals have pointed to many important tops and bottoms in the recent weeks and months, so perhaps the above-mentioned target date will be the date when gold finally bottoms. If gold slides from here this week, the above will become the most likely outcome.
Speaking of target dates, there’s also another very important target date, which is likely to translate into an important reversal.
It’s more or less right now, and the technique that is applied here is gold’s long-term turning point.
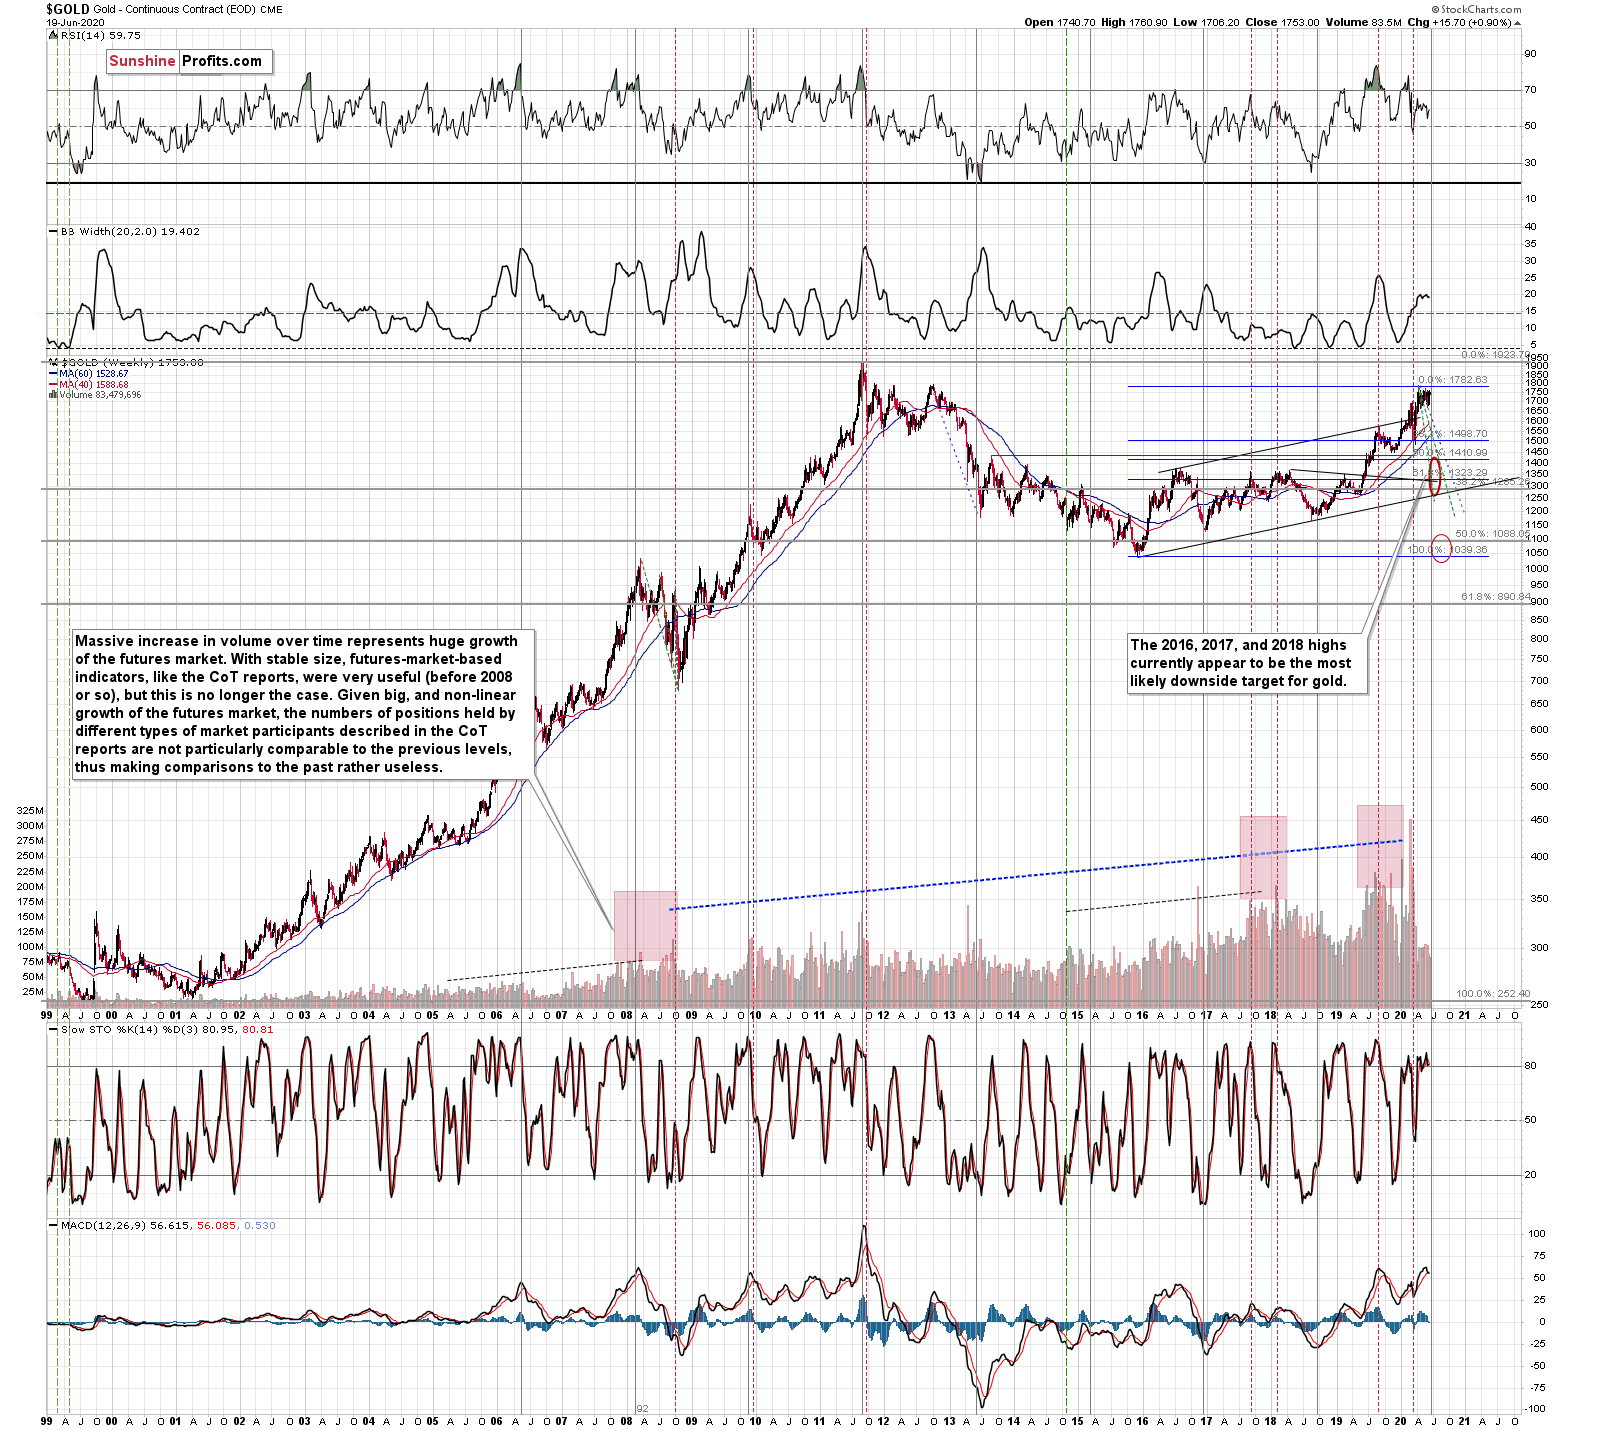
Until the 2011 top, these turning points were tops, and after the 2011 top – in each case – these turning points corresponded to major bottoms. We marked them with vertical, solid, gray lines.
The above means that the upcoming turning point had a slightly bigger chance of being a local bottom, but the most important thing is that there is likely to be some kind of extreme regardless of what type of extreme it is (that’s the key difference between turning points and cycles – the latter have tops and bottoms after each other, while turning points could work in either way).
This means that what we saw earlier today might have been much more than just a temporary attempt to move higher. It might have been a major long-term top after which gold is going to slide in a profound manner.
Since the slide in gold is not likely to take long, but rather be relatively quick (similar to what we saw in March, and similar to the final slide that we saw in 2008), it could be the case that both the major top, and the major bottom will be close to the turning point. That’s exactly what happened in 2011, which was also the only time when gold was trading above $1,500 during the turning point.
Back then, gold plunged almost $400 in less than a month. Since this kind of decline followed somewhat similar technical development, it’s not out of the question that a big and sharp move could happen also in the following 1-3 weeks.
The above also suggests that our “crazy downside targets” are not so crazy after all.
Cup and Handle in Progress?
Naturally, the long-term outlook remains extremely bullish, especially given the possibility of seeing a cup-and-handle formation in gold. The 2011 – now price movement could indeed be the “cup”. Generally, the bigger, more symmetrical, and rounder the “cup” is, the more profound and more bullish the implications are.
There is, however, something that’s missing from the pattern… We have the cup, but we’re missing the handle!
The decline in gold which we wrote about previously would serve as the perfect handle for the massive cup that gold formed in the previous nine years. That’s in perfect tune with what we’ve been expecting for gold anyway – we have been expecting one final slide before the move to new highs, and we would like to stress that getting it would not invalidate the long-term bullishness at all. Conversely, it would confirm it through the cup-and-handle pattern.
Want free follow-ups to the above article and details not available to 99%+ investors? Sign up to our free newsletter today!
Want free follow-ups to the above article and details not available to 99%+ investors? Sign up to our free newsletter today!
Author

Przemyslaw Radomski, CFA
Sunshine Profits
Przemyslaw Radomski, CFA (PR) is a precious metals investor and analyst who takes advantage of the emotionality on the markets, and invites you to do the same. His company, Sunshine Profits, publishes analytical software that any


