Gold’s Line in the Sand: Next Downside Target Is Around $700, Even if It Breaks Up First

Many analysts have been so excited that gold broke to new highs, above $1,262, in late February.
I was excited as well, but for a different reason.
I’d forecast that gold could bounce back just above the July 2016 highs of $1,373, to around $1,400 or $1,450.
And ANY bounce, no matter how high it went, would be a good place to get rid of any gold you’re still holding.
Get rid of it, you should because the precious metal is going down. All the way to $700 an ounce within a year or so, and ultimately likely down to $400 or $450.
Right now, both gold and silver are getting pretty overbought, so it’s a perfect place to unload your final store, and maybe even make a bet against the yellow metal. (We’re just minutes away from letting Boom & Bust subscribers now exactly how to make this play, so be on the lookout for that.)
There is a crystal clear and powerful trend line down through the major tops in gold… and the metal is now right at that line in the sand.
See for yourself…
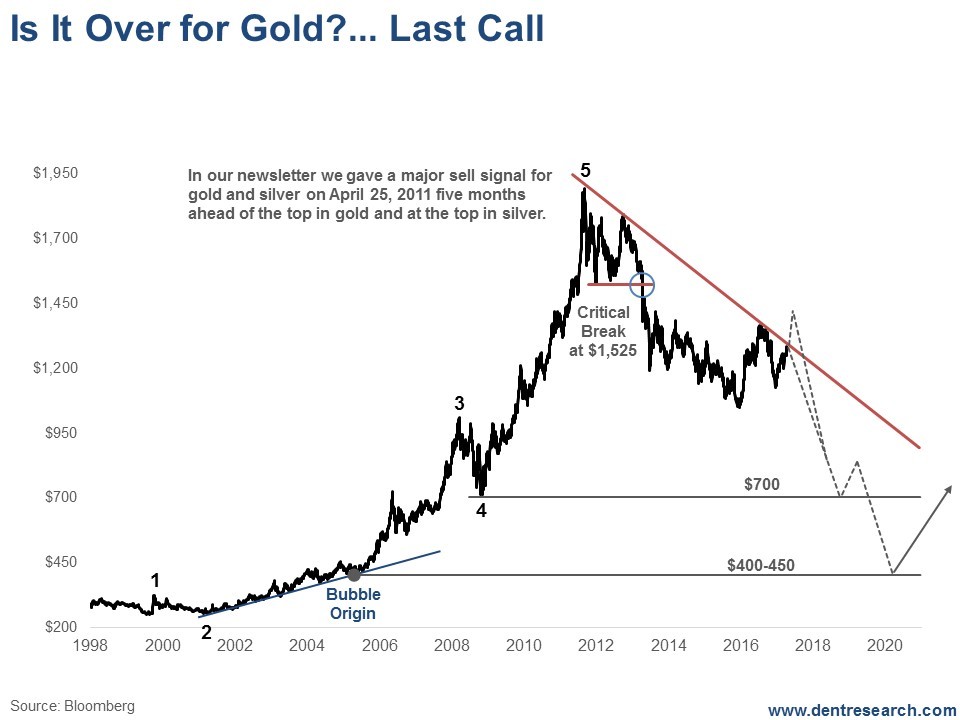
So, here’s the rub.
If gold can’t break above this trend line pretty soon, it’ll likely head for its next major downside target between $650 and $750 in the next year or so.
However, if it can break convincingly above $1,300 then it’ll likely hit a new high above the bear-market-rally level of $1,373. I expect we’ll see something closer to $1,450. Such a move would still chart as just a broader bear market rally… it’s definitely not a sign of a new bull market as many gold bugs are claiming.
I see a similar pattern in silver.
Its downward sloping trend line starts in 2012, just before the dramatic crash in both gold and silver.
The recent silver rally is just approaching that trend line as well.
A break above $18.80 would give us targets of $22 or a bit higher.
But a failure to break this trend line in the coming weeks would suggest a strong break down to the next support level of around $9, from the late 2008 crash low (remember, silver lost 50% in a matter of months!).
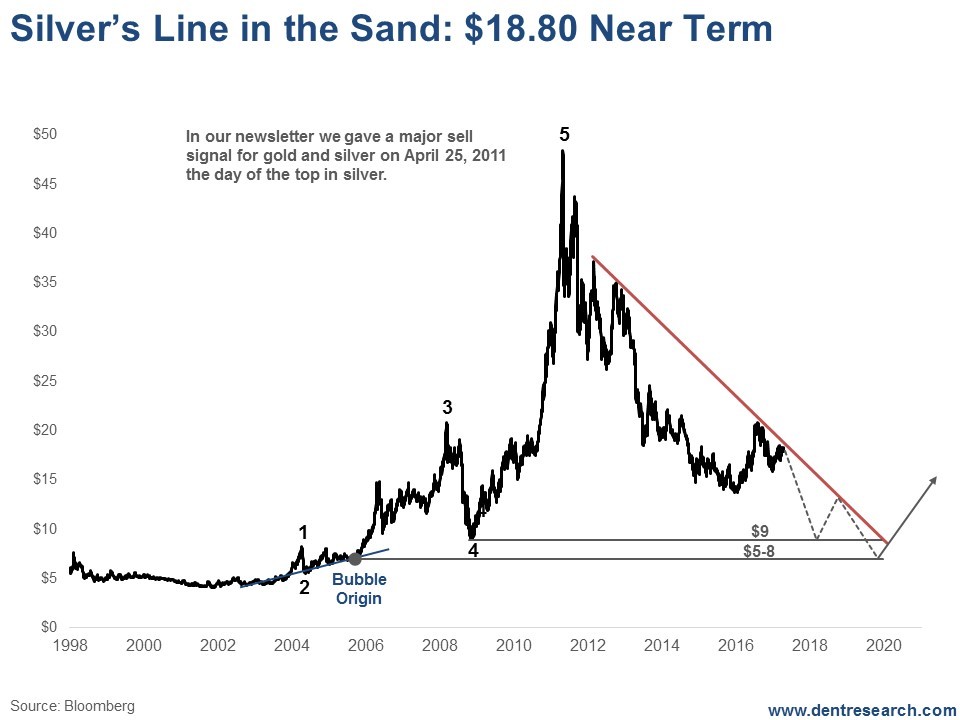
Ultimately, silver’s bubble origin points to an ultimate low around $8. The worst-case scenario is that it goes back to the 2002 low of $5. That’s an 83%-plus crash from its April 2011 bubble high.
The steepness of the silver trend line is good if it holds, because when the metal finally does break above that we’ll know it’s put in a major bottom. That could be confirmed earlier than with gold.
Like gold, I think we could see silver hit a major long-term low by early 2020 as the commodity sector has led this bubble crash thus far and should be the first sector to come out of it.
That said, it’s not ONLY the charts that are signaling it’s time to get our (or bet against) these two metals…
When I look at the smart and dumb money silver traders on Cotbase.com, the large speculators (dumb money) are now record long on silver at 110,000 contracts, even though this has been such a minor rally since December.
The commercials (smart money) are record short, at -120,000 contracts.
This is a very bearish, contrarian sign and suggests silver will get hit harder than gold (again) on the next major slide.
Gold has a different pattern.
The smart money was record short -320,000 contracts and the dumb money record long, with 310,000 contracts at the top in July 2016.
Both have moved in the opposite direction ever since, with much more projected to come.
That tells me the rally from late 2015 was a bear market rally, not the beginning of a new bull market.
The next few weeks should be telling. This may be “last call” for selling precious metals… whether it’s now or several months ahead if we get a break-out above.
In the meantime, Boom & Bust subscribers are about to make a trade with a high upside and low downside risk if we do fail to break this line in the sand near term.
It doesn’t get better than this for a major trade.
Author

Harry S. Dent, MBA
Dent Research
Harry S. Dent Jr. studied economics in college in the ’70s, but found it vague and inconclusive. He became so disillusioned by the state of his chosen profession that he turned his back on it.


