Gold’s foremost lesson from 2013

History rhymes as people tend to react similarly to similar price changes. What we see in gold right now is a repeat of almost a decade ago.
Gold is performing just as in 2013, and it has extremely important implications for the following weeks.
Since I keep reading about how supposedly bullish the current corrective upswing is, I decided to dedicate today’s analysis to showing you just how perfectly normal it is for this correction to be taking place – in tune with what happened in 2013, not against it.
In other words, what we see now is not a bullish game-changer, but rather a very normal repeat of what we already saw almost a decade ago.
History rhymes as people tend to react similarly to similar price developments. The underlying reasons for price moves change, but the forces that really drive the buy and sell decisions remain the same. These forces are fear and greed. Thanks to this, even though the economic, financial, and geopolitical situations are different now than in 2013, the price moves continue to be very, very similar.
The exception is that back in 2013, there was no major military invasion in Europe, and we have one right now. This means that gold – being a safe-haven asset – was practically forced to rally. As gold rallied higher than it did in late 2012, it then declined in a more volatile manner. Since the decline was sharper this year than it was in 2012 and 2013, the correction that we see now is also more volatile. That’s perfectly normal. If you drop a ball from a higher level, it will also bounce higher before falling again, right? However, it will fall, nonetheless.
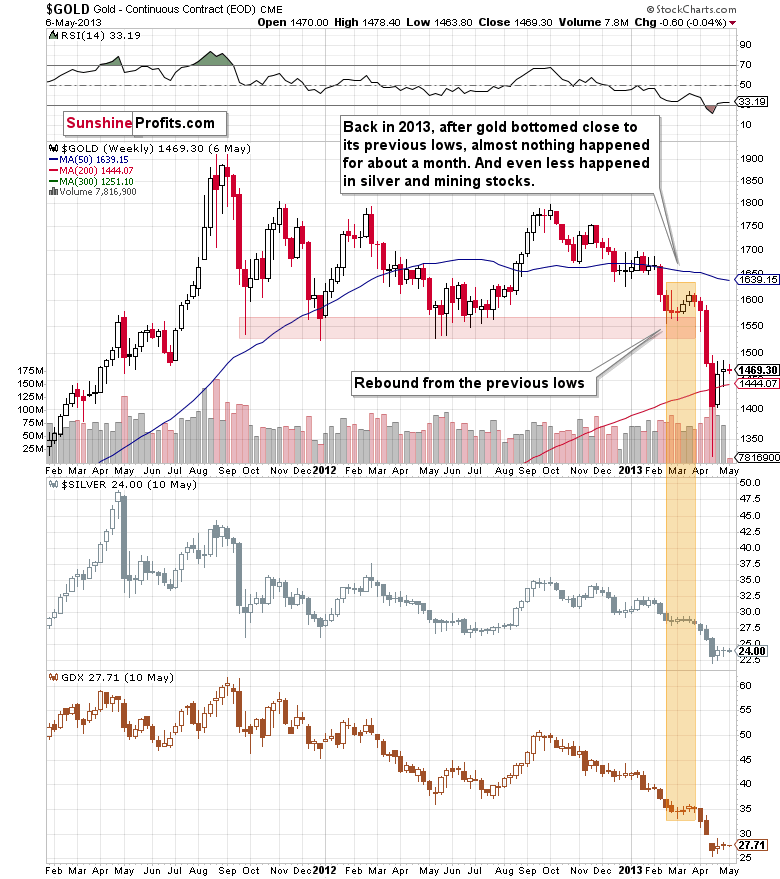
Let’s see what happened in 2013.
Now, let’s see what happened recently.
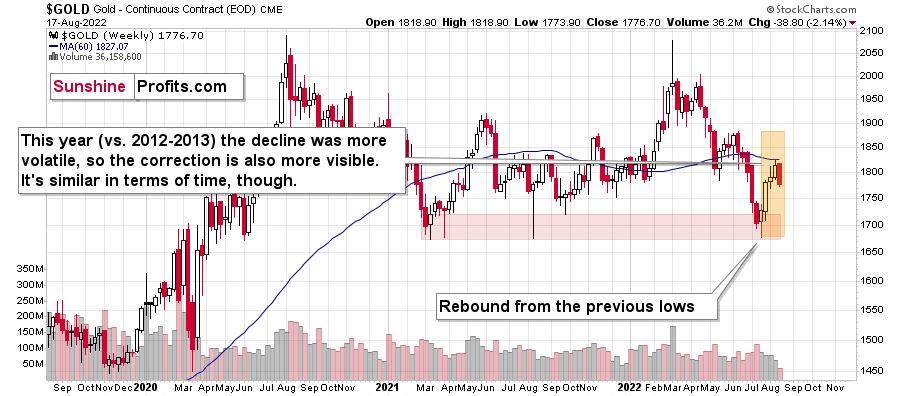
No, it’s not the same chart :). The first one shows gold’s performance between 2011 and mid-2013, and the second shows gold’s performance between late-2019 and today.
The price pattern in gold is so similar, because… history rhymes! Gold got too high too fast in 2011 and the same thing happened in 2020. In fact, if it weren’t for the huge amounts of money that were created due to the pandemic-related stimulus programs, gold would have likely declined instead of rallying. The proof here lies in the fact that, well, it invalidated the breakout above the 2011 high despite the above and despite the Russian invasion.
Think about it: if someone told you a few years ago that there would be a pandemic, global lockdowns, huge amounts of money being printed, double-digit inflation in many parts of the world, and a Russian invasion of Ukraine, would you believe that gold would fail to rally and stay above its 2011 highs?
Very few people would have likely believed that – and yet, that’s exactly what happened, and what’s still happening. Yes, gold “wants” to decline before soaring (and yes, I do think that it will soar, but it’s simply unlikely before sliding first, similarly to what we saw in 2008), and since that’s the case, it has to decline in some sort of price pattern. What’s the most likely way for gold to decline? Since history tends to rhyme, the previous big declines provide guidance. In particular, the 2013 decline has been repeated to a very considerable (quite extreme, actually) extent.
What does this specific self-similarity tell us right now?
It’s telling us… Hmm, no.
It’s screaming right into our ears: watch out!
If the pattern simply keeps repeating itself (which has been taking place for months!), then the huge slide is just ahead. The current correction and back-and-forth trading is likely just the calm before the storm.
Of course, the above is just my opinion, and I can’t promise any kind of performance of any market, including gold, but please note that the previous months’ weakness in gold and silver mining stocks vs. gold are also just like what we saw in 2013 before the huge slide…
I don’t even want to get into the “tiny” fact that while gold moved briefly above its 2011 highs in 2020, neither silver nor gold mining stocks were even close to something similar. Instead, they corrected about a half of their huge decline, and then they started another move lower – a move that continues to this day.
The markets are screaming an important message. However, it’s your choice if you decide to listen to them.
Want free follow-ups to the above article and details not available to 99%+ investors? Sign up to our free newsletter today!
Want free follow-ups to the above article and details not available to 99%+ investors? Sign up to our free newsletter today!
Author

Przemyslaw Radomski, CFA
Sunshine Profits
Przemyslaw Radomski, CFA (PR) is a precious metals investor and analyst who takes advantage of the emotionality on the markets, and invites you to do the same. His company, Sunshine Profits, publishes analytical software that any


