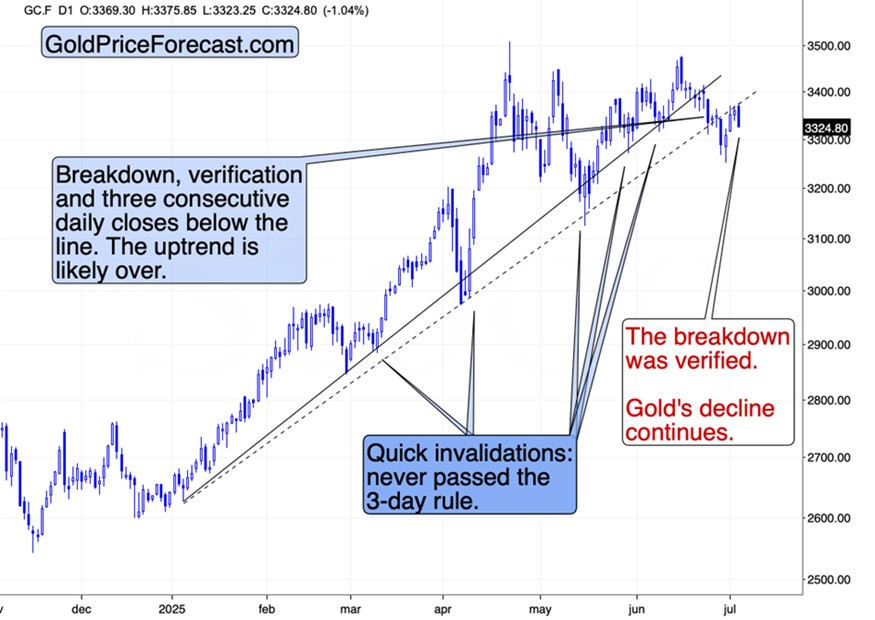
Gold’s breakdown was verified – Decline continues

Remember the story that I outlined in my gold price forecast for July 2025? We saw more of the same yesterday, but on a micro-scale.
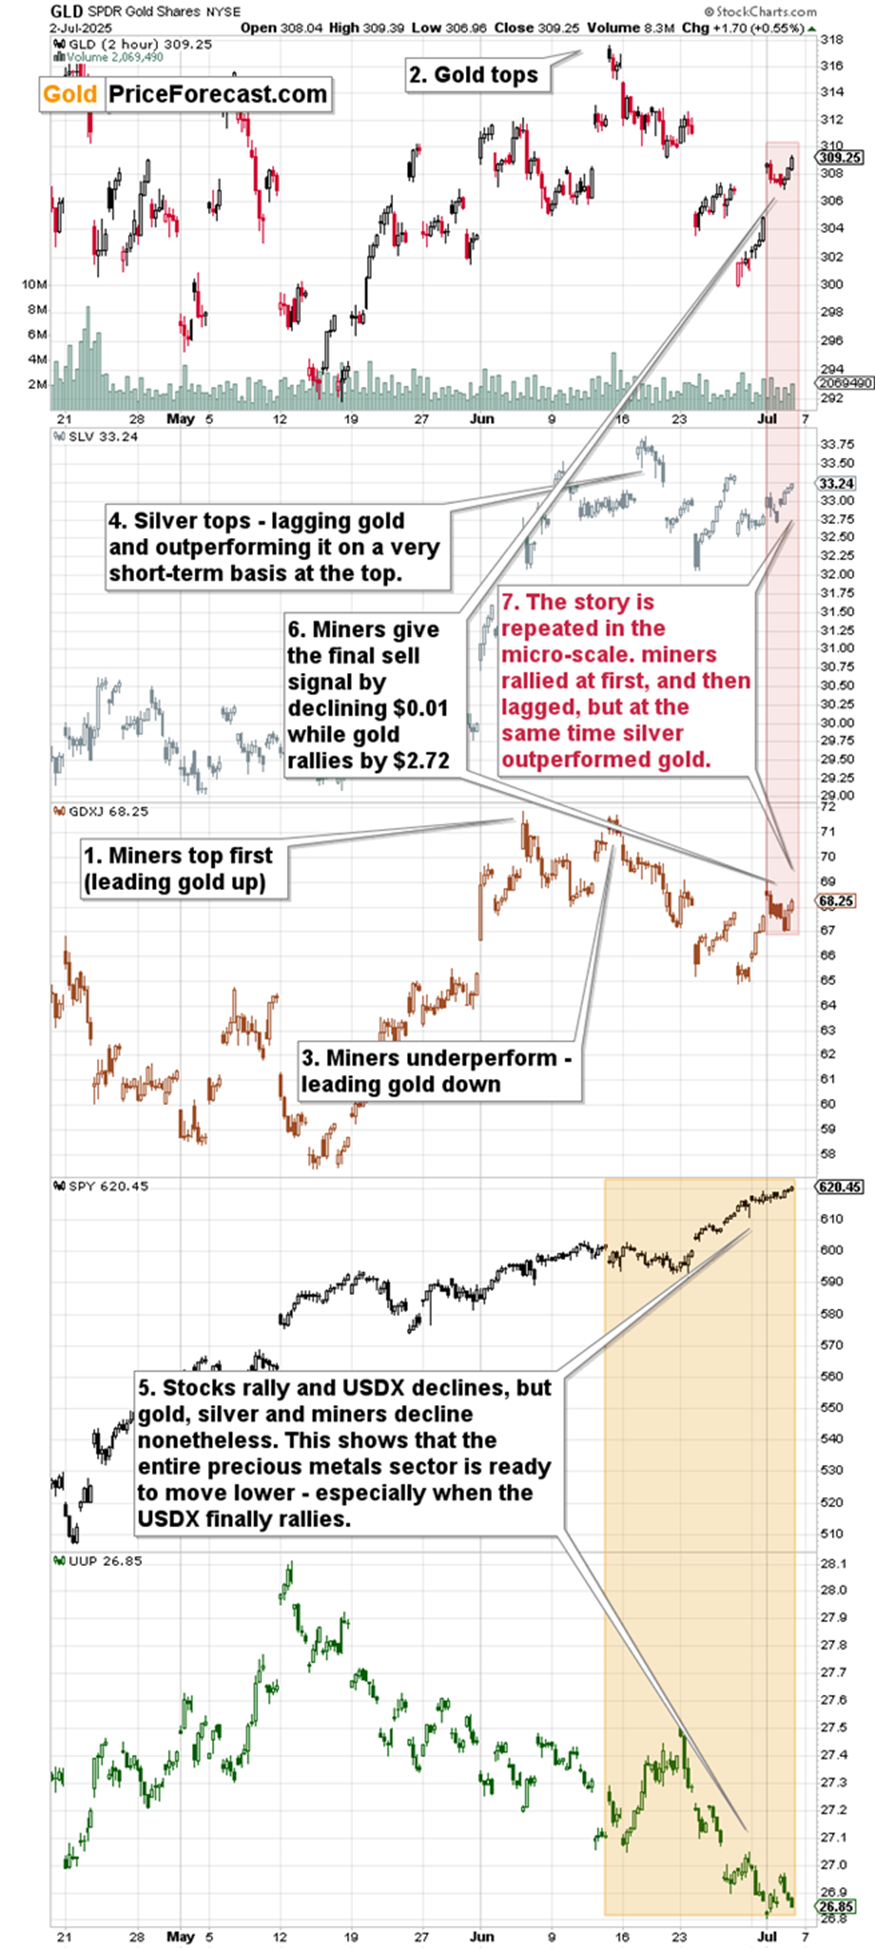
In the previous days/weeks, miners moved higher first, then gold, and finally silver.
The same thing happened in the previous hours/days. Miners moved higher first (in June’s final session they moved higher more than gold and silver did), then gold rallied in the very first session of July, and during yesterday’s session miners lagged gold while silver outperformed. Silver is also outperforming gold today.
This is the mini-version of the same thing, with the same implications. Back then, the implications were bearish on the medium-term basis, and what we just saw and what we see today is bearish on a short-term basis.
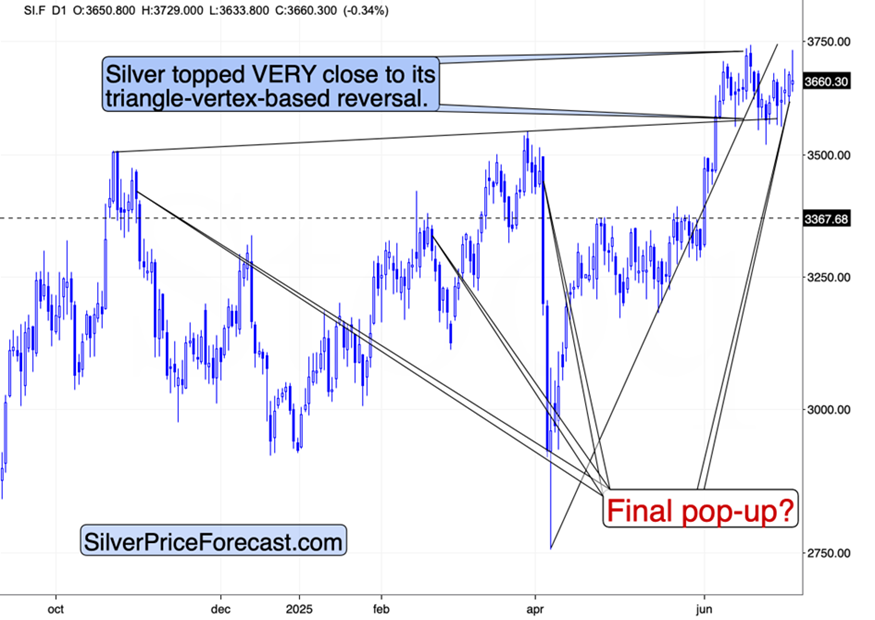
Silver moved to its previous highs (very briefly so, which is typical for those short-term indications coming from the white metal), while gold didn’t.
Gold verified the breakdown below its rising support/resistance line, and now it’s moving back down – another classic technical move.
Gold’s technical picture didn’t change. What silver is doing is aligned with the “story”. And miners did very little yesterday. After the initial move lower, they ended less than 1% higher. Again, that’s typical topping behavior.
Markets cheer tariff hike deal
Copper and platinum prices moved higher yesterday, though.
The markets focused on the seemingly positive trade agreement between the U.S. and Vietnam. That’s in tune with my theory that Trump now needs some results and victories.
Still… does it make sense? Quoting Yahoo!Finance:
“Trump said Vietnam's goods imported to the US would face a 20% tariff, lower than the 46% tariff he had levied as part of his "Liberation Day" plans but higher than the blanket 10% tariff currently in effect. He also said Vietnamese goods would face a higher 40% tariff "on any transshipping" — when goods shipped from Vietnam originate from another country, like China.”
Translation: the tariffs were ultimately increased, not decreased compared to the beginning of 2025. Before the “Liberation Day”, Vietnam enjoyed Most Favored Nation (MFN) status with the U.S – so tariffs of about 3%-5%. The rate was then hiked to 46% and on the same it was lowered to 10%. Now, the agreement points to 20%.
This is a huge increase over the previous 3%-5% - this is what matters, not the fact that it was lowered from the fake (it didn’t even stay in effect for one day) 46% rate. But the markets cheered initially, viewing this as a success.
It might be viewed as a success in negotiations, but it is a blow to the world trade / global growth. It is a fundamental reason for the USD to move higher and for the prices of commodities to move lower.
And yet, the emotional impact was the opposite.
Platinum’s surge warning
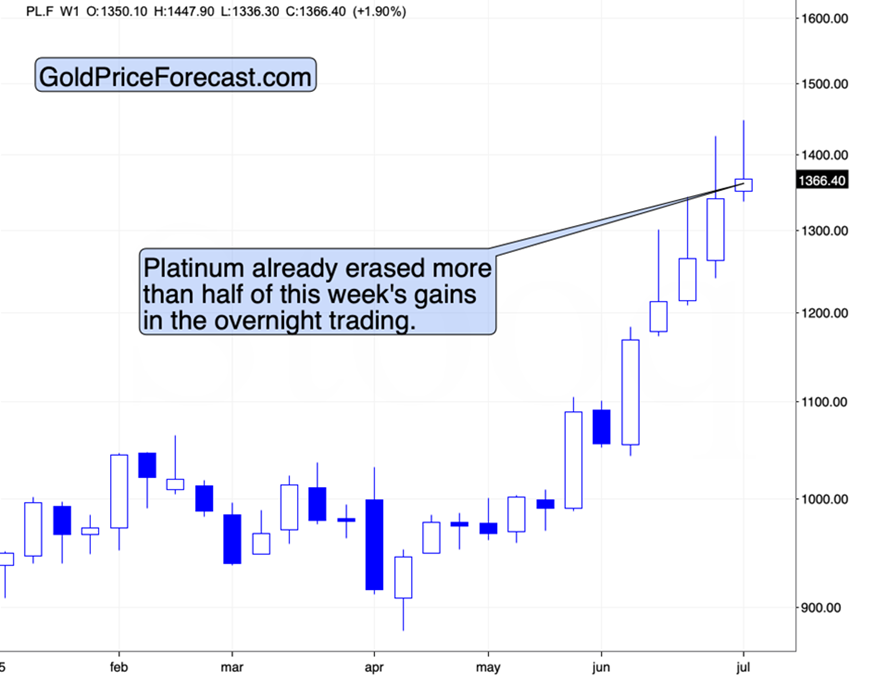
Platinum soared yesterday and while it’s already down today (pretty much erasing yesterday’s rally and forming a shooting star candlestick), yesterday’s upswing showed just how strong the emotional reaction was.
This comes on top of what I wrote about platinum’s extreme sell signal based on its very long-term chart. Quoting my last Friday’s analysis:
(…), I’d like to show you a very long-term chart featuring platinum itself. The data goes back to the late 1960s.
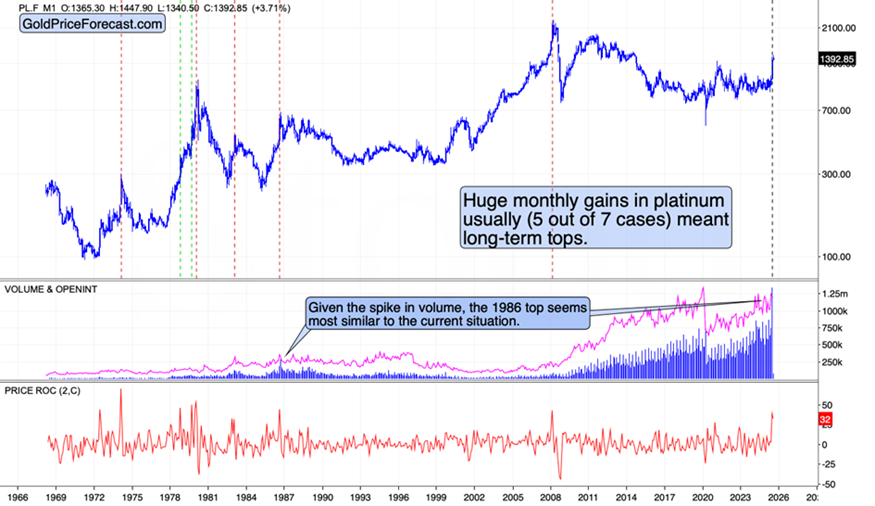
The reason that I’m taking a view this broad is that there are very few analogies in the recent past to how significantly platinum soared this month. This is uncanny and deserves special attention.
Note: I created the above chart yesterday, so it doesn’t include today’s decline.
The bottom of the chart shows the Rate of Change indicator based on the last two months to show how much platinum soared on a short-term basis. The indicator’s goal in this case is to show when monthly rallies were similarly sharp.
There’s only one case in the recent past that is similar and that is the 2008 top. I already wrote about the link between the two situations many times before, and the above chart is one of the confirmations.
However, the list of similar situations doesn’t end there. We saw very similar sharp monthly rallies three times in the 1980s (including at the top!) and three times in the 1970s.
Out of those six cases four happened at major tops, and two were followed by rallies.
“So, maybe we’re in one of those two bullish cases” – you might think. And my answer is that it’s unlikely as when that happened gold was not declining – and in particular it was not weak despite multiple things that should be making it rally.
Consequently, the implication of the current sharp monthly upswing is NOT bullish. It’s clearly bearish. Just because it looks encouraging on a day-to-day basis, it doesn’t change what happened when we saw similar things in the past. There’s no good reason for the situation to be different this time.
This rally doesn’t make fundamental sense – it’s very emotional. The size of the rally itself shows that it’s already huge enough to trigger a reversal – that the emotions are already red-hot and greed is so elevated that it’s time for the market to turn south and decline – quite likely substantially.
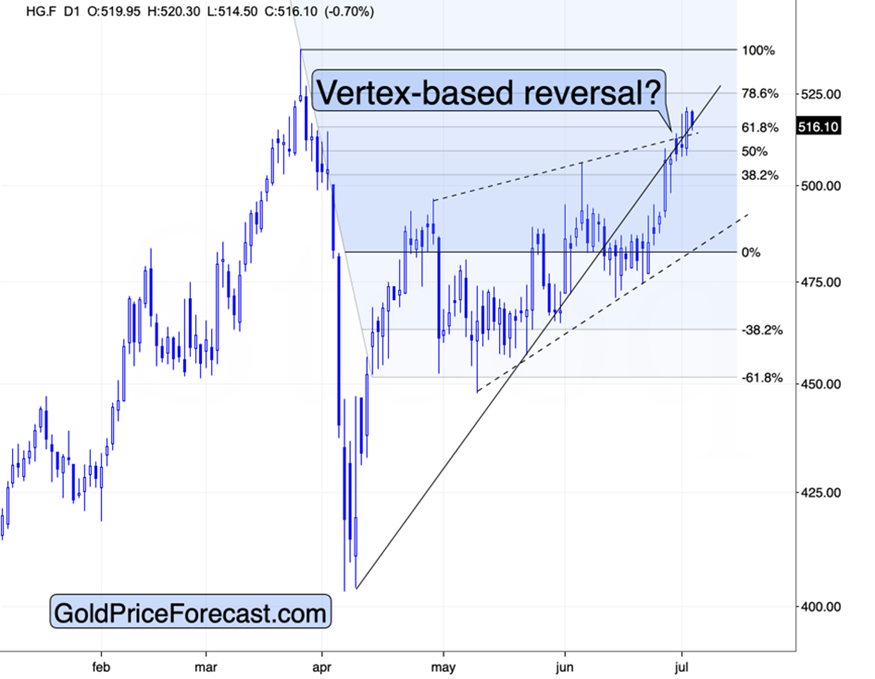
Copper moved down today, but unlike platinum, it hasn’t erased yesterday’s gains – yet.
A rally here makes as just as much sense as the rally in platinum does – it doesn’t.
It’s most likely an emotional overreaction to how the news is being presented. The markets are (were?) still buying the narrative instead of focusing on the facts.
I wrote a longer piece on copper two days ago and pretty much everything remains up-to-date.
Want free follow-ups to the above article and details not available to 99%+ investors? Sign up to our free newsletter today!
Want free follow-ups to the above article and details not available to 99%+ investors? Sign up to our free newsletter today!
Author

Przemyslaw Radomski, CFA
Sunshine Profits
Przemyslaw Radomski, CFA (PR) is a precious metals investor and analyst who takes advantage of the emotionality on the markets, and invites you to do the same. His company, Sunshine Profits, publishes analytical software that any


