Gold Weekly Forecast: The trend continuation pattern is set - all we need now is a price break
- Gold is 0.55% higher this week after a very mixed August.
- Leading into next week there is a chart pattern to look out for.

Gold fundamental backdrop - Wait and see mode
Over the last week, we have seen the US government has still not put together a fiscal stimulus pattern. This was slightly overshadowed by the recent Brexit shenanigans but this has not had a massive impact on the gold price. The dollar is still pretty much in a sideways trend but there was some strength in the EUR after the ECB meeting this week. Not enough to break the consolidation high as the 1.20 area still looks firm for now. Next week's FOMC meeting is now a huge event, analysts have been debating if the Fed are more likely to signal more support for the economy now it seems the US government is in deadlock over fiscal stimulus talks. Now there has been a change to the inflation target there could be more of an operational explanation to how this system will now work through forward guidance. The other key consideration is what rate of unemployment is acceptable before raising interest rates again and what does the Fed consider to be full employment. Ultimately it will be interesting to see how much the Fed can do before the November election as it would be hard to gauge the market reaction.
Gold 4-hour chart - Trendlines and trendlines
The 4-hour chart gives us the best idea about what to expect and look out for next week. The key feature on the chart is the black downward sloping trendline. If the price breaks the level it could increase the likelihood that the recent all-time high could be tested. Beyond this, the blue resistance line at USD 1992.42 per troy ounce is also important. If it breaks then it would create a new wave high which has not been done since the beginning of August. It seems the price has bounced off the aforementioned trendline today (Friday) and this could have bearish implications. On the downside, the next resistance lies at the red line (USD 1914 per troy ounce). If there is a break of the red horizontal line then the bulls could be in trouble and the consolidation low of USD 1863.24 per ounce could be under threat. As this is a long term uptrend the levels on the upside are in focus and the first point of call would be the trendline break.
-637354414889372008.png)
The week ahead - FOMC meeting is the main event
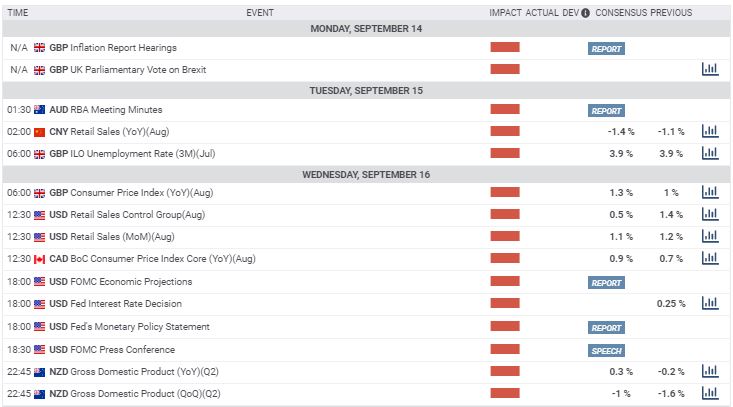
There are lots of events to look forward to next week and the aforementioned FOMC meeting is the highlight. The Bank of England rate decision is also important but the implications on gold could be limited.
In the early part of the week, Chinese retail sales are expected to come in a -1.4% but and this could be interesting as if there is a beat here it could mean there is more disposable income than analyst had been expecting and longer-term could be bullish for gold. Then the day after it is the US turn but the US retail market is not as mad for gold as the Chinese.
Sentiment
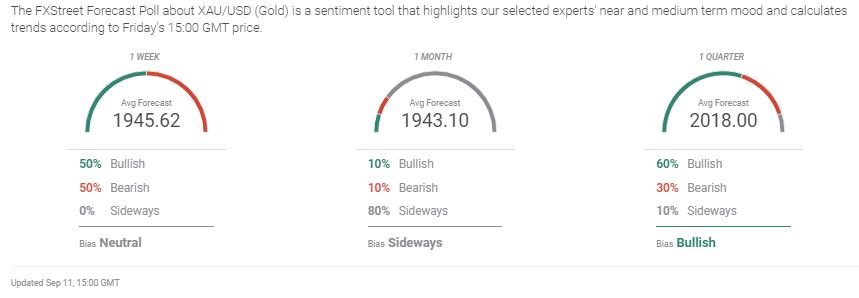
The latest FXStreet poll indicates traders feel like the longer-term outlook is bullish and the price could break back above USD 2k per ounce level once again. In the medium term, the pollsters feel the price will continue to move sideways. This is pretty much consistent with the theme in the market. The price is in a firm uptrend on the higher timeframes but at the moment the commodity is in a consolidation period.
Links to other articles
Gold Weekly Forecast: Full consolidation mode at the moment but 2K is still an important resistance
Gold reaches $2,000 amid dollar depreciation
Stock rollercoaster ride continues, UK/Japan trade deal, oil steady, gold softer
Premium
You have reached your limit of 3 free articles for this month.
Start your subscription and get access to all our original articles.
Author

Rajan Dhall, MSTA
FX Daily
Rajan Dhall is an experienced market analyst, who has been trading professionally since 2007 managing various funds producing exceptional returns.


