Gold Weekly Forecast: Possible correction to $1,800 as key resistance holds
- Gold fell sharply on Friday but closed the week in the green.
- Bulls failed to hold the price above the 200-day SMA.
- Downward correction could extend toward $1,800 in the short term.

After closing the previous three weeks in the positive territory, gold stayed relatively quiet on Monday and Tuesday but managed to regain its traction on Wednesday. Following a 1% increase mid-week, the XAU/USD pair preserved its bullish momentum and touched its highest level in a month at $1,834 on Thursday but retraced a large portion of its rally on Friday. Nevertheless, gold settled above $1,810 and registered small weekly gains.
What happened last week
At the start of the week, the risk-averse market environment provided a boost to the greenback. Reflecting the broad-based USD strength, the US Dollar Index (DXY) posted modest daily gains on Monday and extended its rally after the June inflation data on Tuesday, rising 0.6% on that day.
The US Bureau of Labor Statistics reported that annual inflation, as measured by the Consumer Price Index (CPI), jumped to 5.4% in June from 5% in May. This reading came in higher than the market expectation of 4.9%. Furthermore, the Core CPI, which excludes volatile food and energy prices, climbed to 4.5% on a yearly basis from 3.8%.
Nevertheless, XAU/USD’s downside remained limited as buyers continued to defend the key support located at $1,800.
On Wednesday, FOMC Chairman Jerome Powell’s prepared remarks for delivery at the US Federal Reserve’s semiannual Monetary Policy Report to the US House Committee on Financial Services triggered a USD sell-off and allowed gold to push higher.
Powell reiterated that the monetary policy will continue to deliver powerful support and noted that it is still appropriate for policy to remain highly accommodative. "The job market is still a ways off from the progress needed to begin the bond-buying taper,” Powell added. The dovish tone caused the DXY to retrace the majority of Tuesday’s upside.
On Thursday, the data from the US revealed that the Initial Jobless Claims declined to the lowest level in nearly 17 months at 360,000 in the week ending July 10. Additionally, the NY Empire State Manufacturing Index improved to 43 in July from 17.4 in June, beating analysts’ estimate of 18 by a wide margin. On a negative note, the Fed reported that Industrial Production in June expanded by 0.4%, compared to the market consensus of 0.7%. Despite the mixed data, the DXY staged a modest rebound and caused XAU/USD to go into a consolidation phase ahead of the weekend.
Finally, the US Census Bureau’s monthly publication showed on Friday that Retail Sales increased by 0.6% in June, surpassing the market forecast for a decline of 0.4%. On a negative note, the University of Michigan’s Consumer Sentiment Index edged lower to 80.8 in July’s advanced estimate from 85.5 in June. Moreover, the 1-year Inflation Outlook component of the survey jumped to 4.8%, the highest level since August 2008, from 4.2%. Despite the mixed data releases, the dismal market mood helped the USD to continue to find demand ahead of the weekend and weighed on XAU/USD.
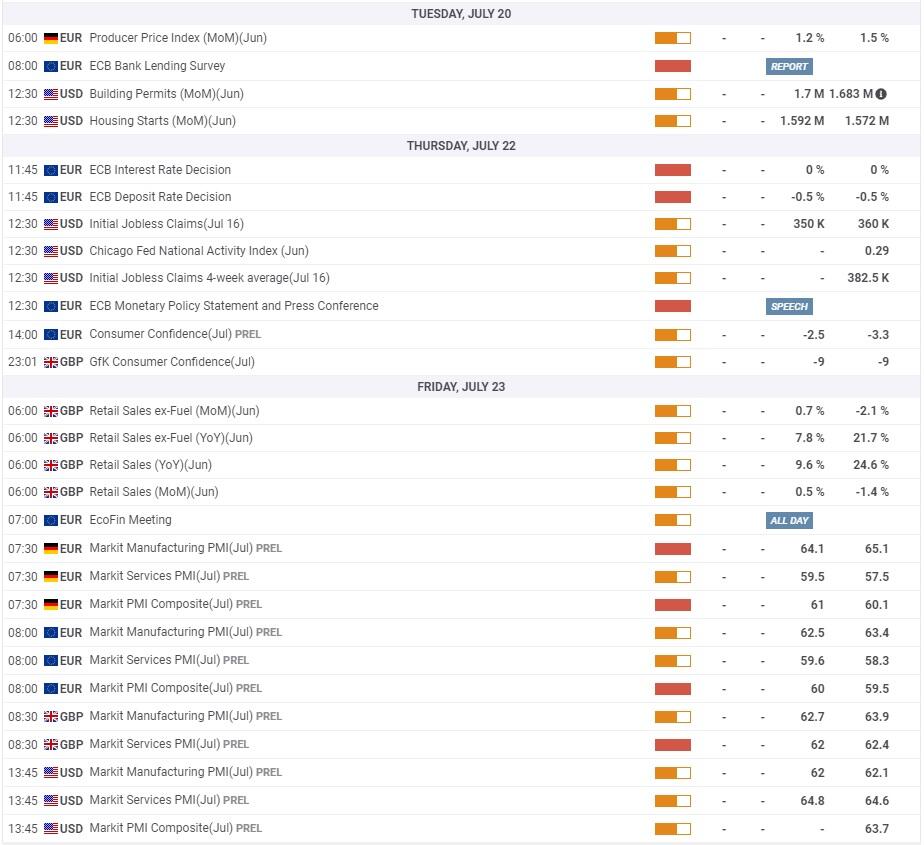
Next week
There will not be any high-tier data releases during the first half of next week. During that time period, the USD’s market valuation is likely to drive XAU/USD’s movements within the boundaries of significant technical levels. On Thursday, the European Central Bank (ECB) will announce its Interest Rate Decision and release the Monetary Policy Statement. However, the ECB already unveiled its revised policy strategy and the bank is unlikely to offer any fresh insights into its policy outlook.
On Friday, the IHS Markit’s preliminary July Manufacturing and Services PMI figures from Germany, the euro area and the US will be looked upon for fresh impetus. Rather than the headline figures, investors are likely to pay close attention to the underlying details regarding the input price pressures.
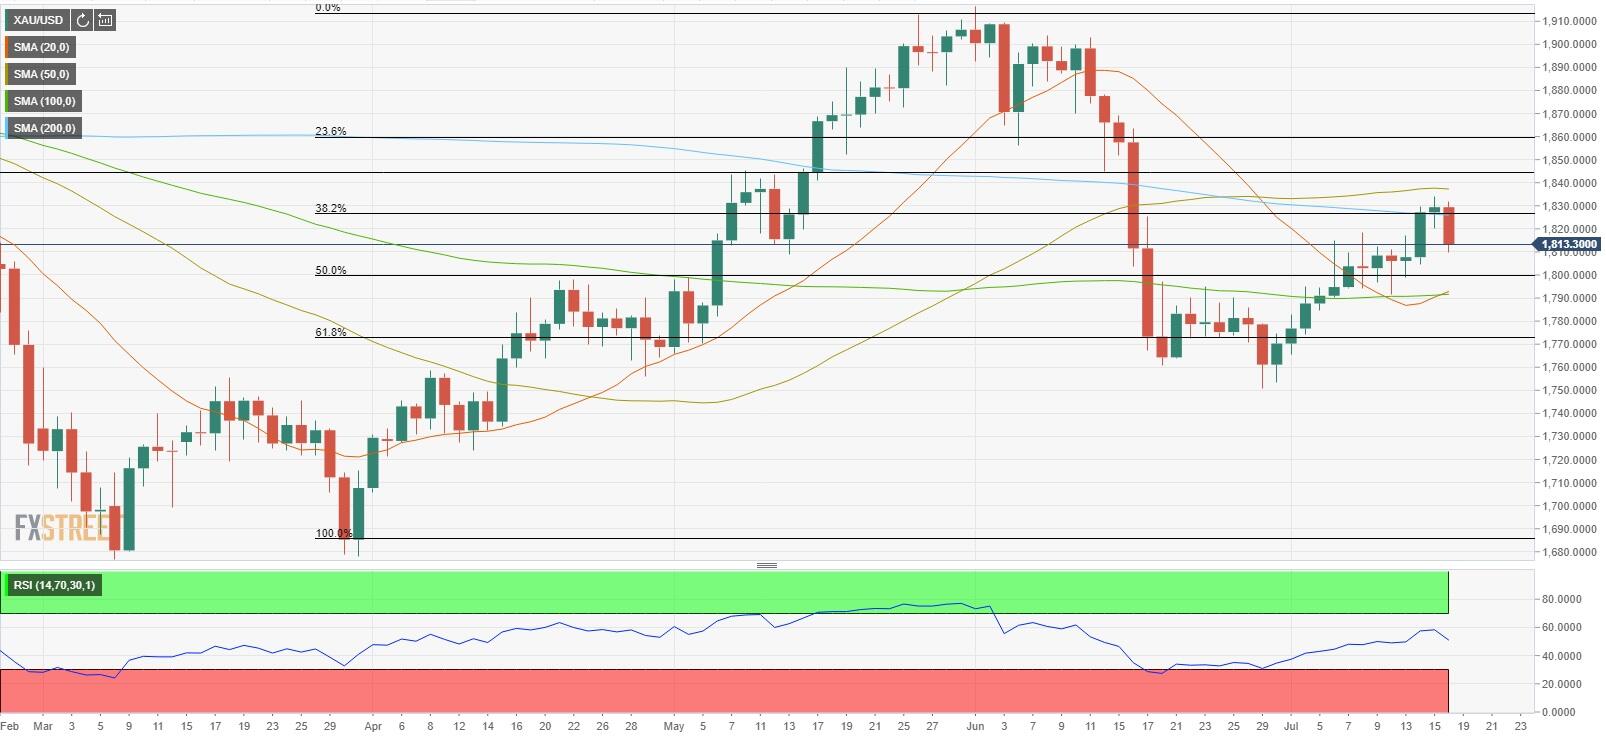
Gold technical outlook
On the daily chart, the Relative Strength Index (RSI) edged lower toward 50 on Friday, suggesting that the bullish momentum started to weaken. Additionally, buyers failed to keep gold afloat above the critical 200-day SMA, which is currently located at $1,825. Both of these developments suggest that XAU/USD could stage a technical correction in the near term before the next leg up.
On the downside, strong support seems to have formed at $1,800 (psychological level, Fibonacci 50% retracement of April-June uptrend). A daily close below that level could open the door for additional losses toward $1,790 (100-day SMA, 20-day SMA).
Resistances are located at $1,825 (Fibonacci 38.2% retracement, 200-day SMA), $1,834 (July 15 high, 50-day SMA) and $1,845 (static level).
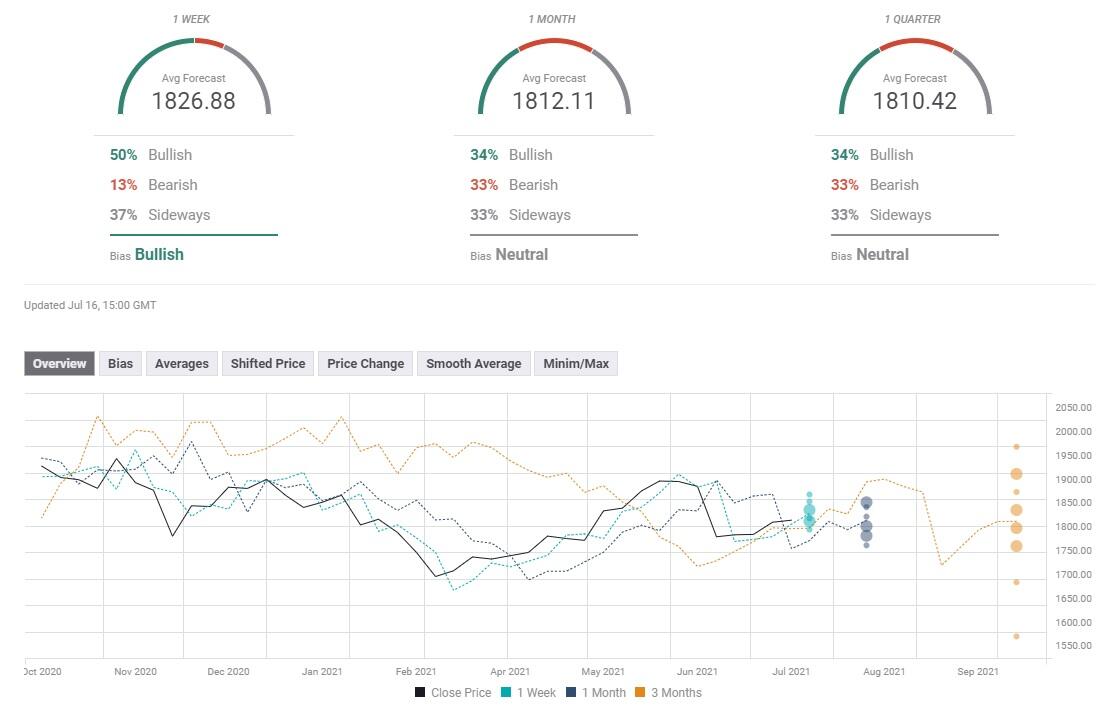
Gold sentiment poll
Despite Friday’s pullback, the FXStreet Forecast Poll shows that half of experts remain bullish in the near term with a target of $1,826 on a one-week view. The one-month-view, however paints a mixed picture with experts splitting evenly between bullish, bearish and neutral biases.
Author

Eren Sengezer
FXStreet
As an economist at heart, Eren Sengezer specializes in the assessment of the short-term and long-term impacts of macroeconomic data, central bank policies and political developments on financial assets.


