Gold Weekly Forecast: Next direction entirely depends on US-Iran outcome
- Gold recovers above $4,500 following the bearish action seen in the first half of the week.
- The next directional movement is likely to come once US-Iran talks are finalized.
- The technical outlook highlights buyers’ hesitancy in the short term.

Gold (XAU/USD) dropped to its lowest level in two months but managed to erase a large portion of its weekly losses. Investors await the next batch of high-impact economic data releases from the United States (US), while contradicting headlines surrounding the negotiations between the US and Iran make it difficult for the precious metal to find direction.
Gold rebounds as markets grow optimistic about a US-Iran MOU
Gold edged higher at the start of the week after Axios reported late Saturday that the US and Iran were close to signing an agreement that involves a 60-day ceasefire extension during which the Strait of Hormuz would be reopened. Still, XAU/USD’s action was relatively subdued on Monday as trading volumes remained thin, with US financial markets staying closed in observance of the Memorial Day holiday.
On Tuesday, Gold turned south following a fresh reescalation of tensions in the Middle East. The US military targeted Iranian missile launch sites and mine-laying vessels in southern Iran in what it called "self-defense strikes," and Iran’s Armed Forces warned that any new aggression against Iran would be met with a "far more severe" response extending beyond the region.
After losing more than 1% on Tuesday, Gold remained under bearish pressure midweek and touched its lowest level in two months near $4,400. Although market mood improved slightly after Iran's State TV reported that the unofficial framework of the Memorandum of Understanding (MOU) with the US has the US military forces withdrawing from the vicinity of Iran and lifting the naval blockade, investors turned cautious once again as US President Donald Trump noted that he will not be rushed into a deal. Moreover, Iran targeted an American air base that they believed to be the source of attacks against Iranian drones and missile launch sites.
Following an extended slide during the European trading hours to a fresh two-month low below $4,370 on Thursday, Gold staged a decisive rebound and closed the day in positive territory. Several news outlets claimed that the US and Iran had reached an agreement on an MOU, and the White House confirmed these reports but also noted that US President Donald Trump had yet to give his approval. On the other hand, citing a source close to Iran's negotiating team, Iran’s semi-official Tasnim news agency reported that the text of the MOU had not yet been finalised or confirmed.
In the meantime, the US Bureau of Economic Analysis (BEA) reported that annual inflation in the US, as measured by the change in the Personal Consumption Expenditures (PCE) Price Index, climbed to 3.8% in April from 3.5% in March. In this period, the core PCE Price Index, which excludes volatile food and energy prices, rose 3.3%, as anticipated. Additionally, the BEA revised the annualized GDP growth for the first quarter lower to 1.6% from 2% reported in the initial estimate. The USD further weakened on these data, helping XAU/USD reclaim $4,500.
Markets adopted a cautious stance while waiting for official word on US-Iran talks on Friday but Gold managed to stay in positive territory above $4,500 heading into the weekend.
Gold investors await US employment data
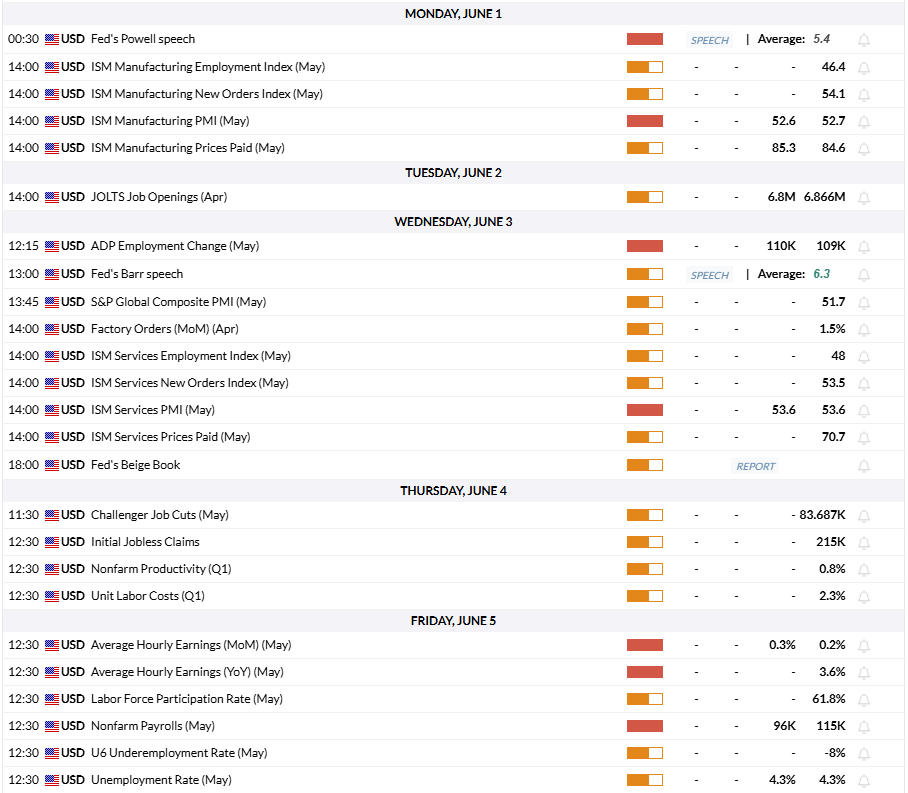
The US economic calendar will feature the Institute for Supply Management’s (ISM) Manufacturing and Services Purchasing Managers’ Index (PMI) data on Monday and Wednesday, respectively. Headline PMI readings for both surveys are expected to remain in the expansion territory above 50. Unless these figures unexpectedly drop into the contraction region, investors are likely to ignore them and scrutinize the inflation component of PMI surveys, the Prices Paid Index. An increase in this component would highlight strengthening pressure on input prices and support the USD with the immediate reaction. Conversely, a noticeable decline could have the opposite effect and help XAU/USD hold its ground.
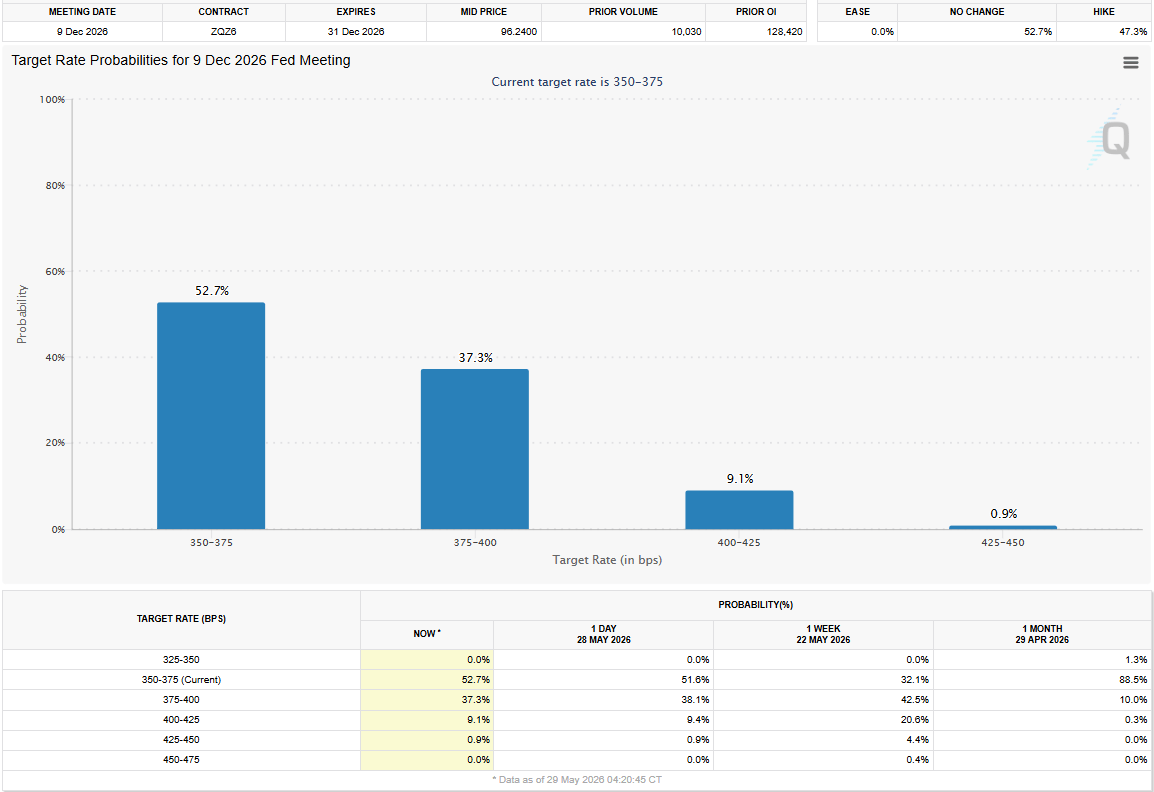
On Friday, the US Bureau of Labor Statistics (BLS) will publish the employment report for May. A positive surprise in Nonfarm Payrolls (NFP), following the much better than expected 185K and 115k prints in March and April, respectively, could feed into market expectations for a Federal Reserve (Fed) interest rate hike later in the year, as it would suggest that policymakers are likely to prioritize controlling inflation. According to the CME FedWatch Tool, markets are currently pricing in about a 50% probability that there will be at least a 25-basis-points hike by the end of the year. In this scenario, the USD could gather strength with the immediate reaction and cause XAU/USD to edge lower heading into the weekend.
On Wednesday, Fed Governor Lisa Cook said that the labor market is “largely stable” but acknowledged that downside risks are elevated. Similarly, Fed Vice Chair Philip Jefferson noted on Thursday that the labor market is steady with risks skewed to the downside.
Gold’s action since the beginning of the US-Iran conflict made it clear that investors’ reaction to data releases remains short-lived. If the US and Iran officially sign the MOU and open the Strait of Hormuz, Gold could edge higher in response. However, it is difficult to say how much upside potential there is for the yellow metal since markets may have already priced in the MOU. Nevertheless, a steady decline in Oil prices could ease inflation fears over time and continue to support XAU/USD even if news of a deal doesn’t trigger a significant directional movement. On the flip side, Gold could come under renewed bearish pressure if President Trump rejects the MOU, or if fighting escalates in the region and derails hopes of a truce agreement.
Gold technical analysis: Short-term outlook is yet to signal a bullish reversal
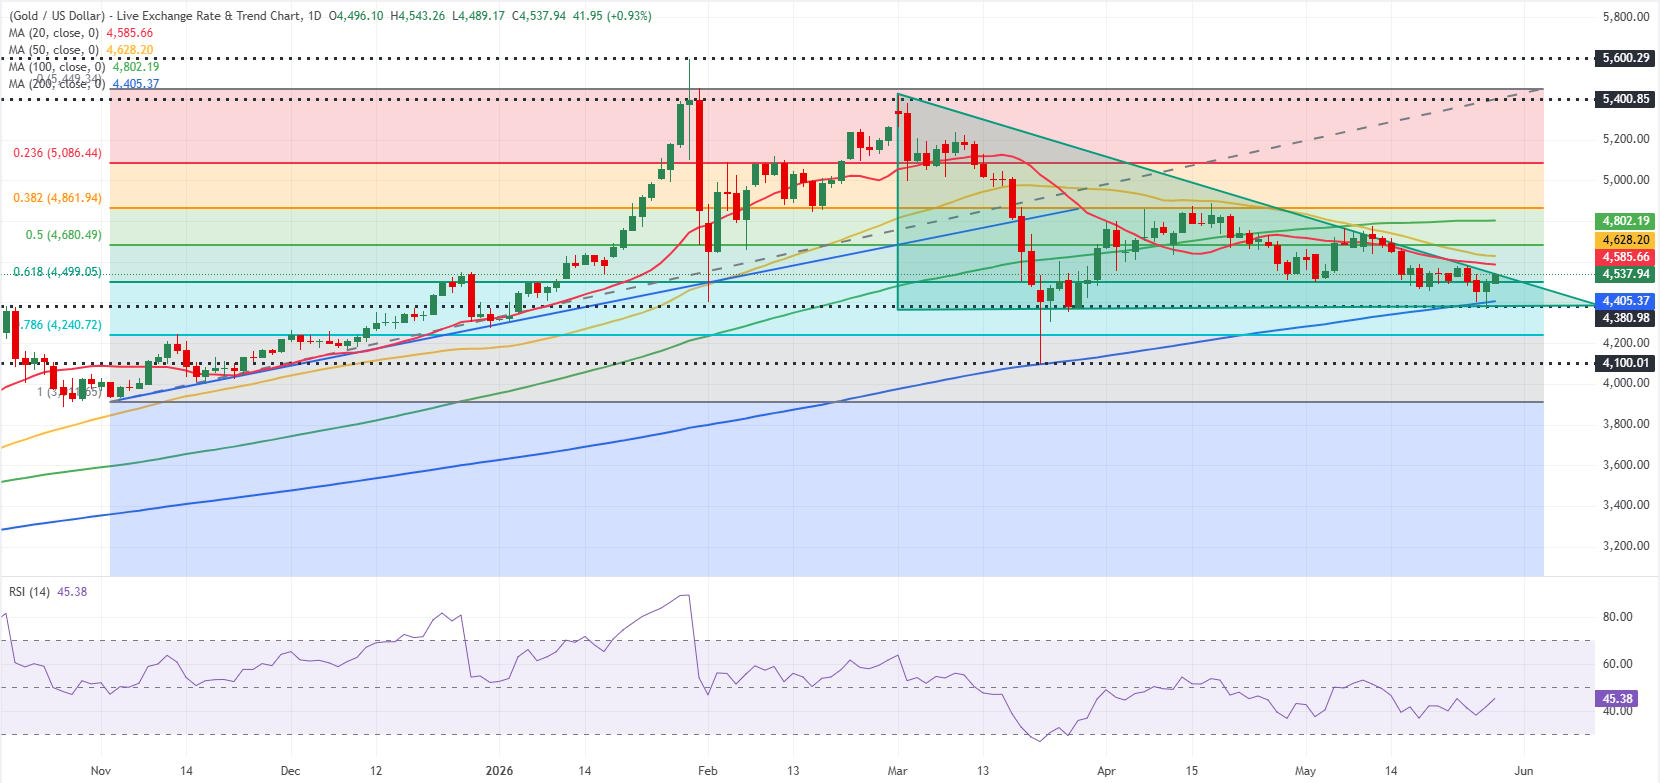
Gold recovered after testing the 200-day Simple Moving Average (SMA) and the bottom line of a descending triangle pattern on the daily chart, confirming the significance of this support in the $4,380-$4,400 region. In the meantime, XAU/USD is yet to reflect a bullish reversal as it remains below the 20-day, 50-day and 100-day SMAs, while the Relative Strength Index (RSI) indicator stays underneath 50.
In case Gold drops below $4,380-$4,400 and flips that area into resistance, technical sellers could dominate the action and open the door for another leg lower toward $4,240, the Fibonacci 78.6% retracement level of the November-February uptrend, and $4,100 (static level, round level).
On the upside, $4,560-$4,585 (descending trend line, 20-day SMA) aligns as the next hurdle before $4,680 (Fibonacci 50% retracement) and $4,800 (100-day SMA).
Gold FAQs
Gold has played a key role in human’s history as it has been widely used as a store of value and medium of exchange. Currently, apart from its shine and usage for jewelry, the precious metal is widely seen as a safe-haven asset, meaning that it is considered a good investment during turbulent times. Gold is also widely seen as a hedge against inflation and against depreciating currencies as it doesn’t rely on any specific issuer or government.
Central banks are the biggest Gold holders. In their aim to support their currencies in turbulent times, central banks tend to diversify their reserves and buy Gold to improve the perceived strength of the economy and the currency. High Gold reserves can be a source of trust for a country’s solvency. Central banks added 1,136 tonnes of Gold worth around $70 billion to their reserves in 2022, according to data from the World Gold Council. This is the highest yearly purchase since records began. Central banks from emerging economies such as China, India and Turkey are quickly increasing their Gold reserves.
Gold has an inverse correlation with the US Dollar and US Treasuries, which are both major reserve and safe-haven assets. When the Dollar depreciates, Gold tends to rise, enabling investors and central banks to diversify their assets in turbulent times. Gold is also inversely correlated with risk assets. A rally in the stock market tends to weaken Gold price, while sell-offs in riskier markets tend to favor the precious metal.
The price can move due to a wide range of factors. Geopolitical instability or fears of a deep recession can quickly make Gold price escalate due to its safe-haven status. As a yield-less asset, Gold tends to rise with lower interest rates, while higher cost of money usually weighs down on the yellow metal. Still, most moves depend on how the US Dollar (USD) behaves as the asset is priced in dollars (XAU/USD). A strong Dollar tends to keep the price of Gold controlled, whereas a weaker Dollar is likely to push Gold prices up.
Author

Eren Sengezer
FXStreet
As an economist at heart, Eren Sengezer specializes in the assessment of the short-term and long-term impacts of macroeconomic data, central bank policies and political developments on financial assets.