Gold Weekly Forecast: Could the small pullback be the start of a retracement
- Gold is 1.73% lower on Friday but 2.65% higher on the week.
- The positive non-farm payroll data send the greenback climbing.

Fundamental backdrop - All about the jobs data
This week the gold price had been climbing leading into the main event on Friday. The data beat analyst consensus estimates of 1.6mln to print at 1.763mln. This comes despite major disruptions from the coronavirus pandemic. Also of note, the unemployment rate fell to 10.2% from 11.1%. Back to the NFP result, the lowest estimate came from Natwest at 200k and the highest was 2.66mln so the number printed comfortably within the estimated range. At the time there was not a massive reaction in gold and the price even moved up slightly but 30 mins later the price crashed to head toward the session lows of USD 2022.59.
This week the PMI numbers also impressed, on Monday the ISM Manufacturing PMI for July came in at 54.2 vs expectations of 53.6. Then later on in the week, ISM Non-Manufacturing PMI for the same month beat consensus estimates of 55.0 and hit 58.1. Obviously things are not soo rosy in the US overall as the COVID-19 pandemic is still not under control. US President Trump's answer seems to be a vaccine rather than more lockdowns as he stated one may be available by 3rd November. This is coincidently the same date as the US election.
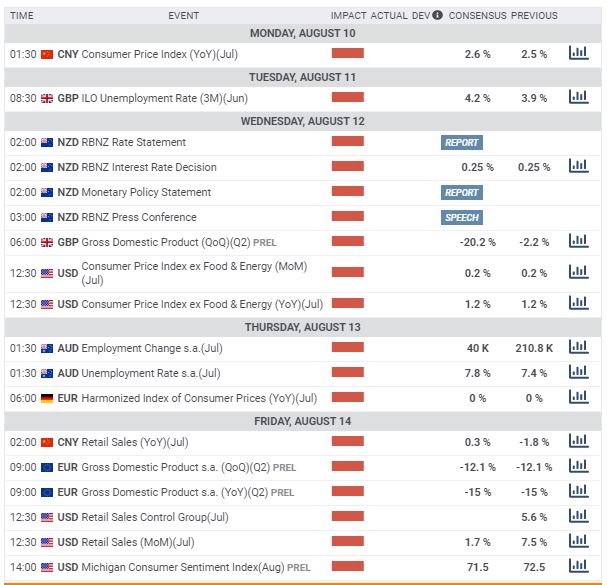
Week ahead - US CPI could be the highlight
The price of gold next week could be impacted by the consumer price index print for July. This could move slightly higher as the recent dollar weakness might have an effect of import prices for the next few months. The market expectation at the moment is around 1.2% year on year. The Federal Reserve's target is 2% and any move closer to that number could mean more USD strength and therefore gold weakness.
The latest news on the China-US trade war is more positive. Executives from both nations have agreed to "high level" talks on 15th August. The main subject of the talks will be phase one trade deal compliance. There will probably other things on the agenda and the tone of the talks could move the markets.
Gold weekly chart
It is hard to perform technical analysis on a chart that is moving up like a rocket. The next major support zone on the way down is the psychological USD 2k per troy ounce level. Beyond that, the previous all-time high of USD 1920.94 per ounce is the next major support to watch. This move lower might not be the end of the trend and this is likely to be a small retracement. Until a lower high lower low formation is made on the daily chart it's fair to say this is just a short term pullback.
-637324183240580251.png)
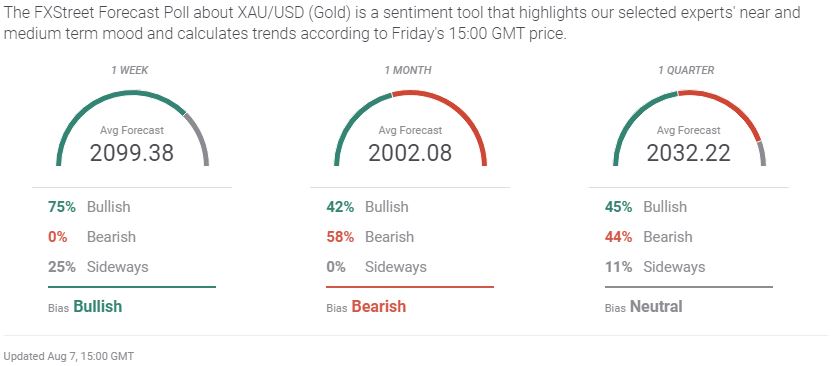
Current market sentiment
This week there is at least one group that think the price of gold will increase. The short term forecasters believe that the price could hit USD 2100 per ounce in a weeks time. The 1-month and 1-quarter forecasts are slightly more bearish. Over the last four weeks if you used the poll as a contrary indicator then you may have made some money. Only time will tell if the upcoming week will be the same.
Links to other gold articles
XAU/USD drops $50 from record highs to the $2020 area
Gold Weekly Forecast: There are some very interesting Fibonacci extensions from the 1980's
Premium
You have reached your limit of 3 free articles for this month.
Start your subscription and get access to all our original articles.
Author

Rajan Dhall, MSTA
FX Daily
Rajan Dhall is an experienced market analyst, who has been trading professionally since 2007 managing various funds producing exceptional returns.


