Gold Weekly Forecast: Buyers could stay on sidelines while markets doubt Fed rate cut
- Gold struggled to attract buyers but managed to hold above $4,000.
- Markets see a diminishing chance of a Fed rate cut in December.
- The technical outlook highlights a lack of bullish interest in the short term.

Gold (XAU/USD) edged lower after rising more than 2% in the previous week but stabilized above $4,000. Diminishing bets of a Federal Reserve (Fed) interest rate cut could keep the bulls at bay as markets wait for the US economic data backlog to clear.
Gold declines on hawkish FOMC Minutes
Gold benefited from the risk-averse market atmosphere to start the week and kept its footing on Monday and Tuesday. Meanwhile, the weekly data published by Automatic Data Processing showed on Tuesday that private employers shed an average of 2,500 jobs a week in the four weeks ending November 1.
The minutes of the Fed’s October meeting showed on Wednesday that many policymakers thought that, under their outlooks, it would be appropriate to keep rates unchanged for the rest of the year. "Most participants noted further rate cuts could add to the risk of higher inflation becoming entrenched or could be misinterpreted as a lack of commitment to the 2% inflation objective," the publication read.
According to the CME FedWatch Tool, the probability of a 25-basis-points (bps) Fed rate cut in December declined to nearly 35% from about 50% earlier in the week. In turn, the US Dollar (USD) gathered strength and caused XAU/USD to lose its traction in the second half of the day.
On Thursday, the US Bureau of Labor Statistics (BLS) reported that Nonfarm Payrolls (NFP) rose by 119,000 in September. This print followed the 4,000 decrease recorded in August and surpassed the market expectation of 50,000. On a negative note, the BLS noted that the change in NFP for July and August was revised down by 7,000 and 26,000, respectively. Other details of the report showed that the Unemployment Rate edged higher to 4.4% in September from 4.3%, while the annual wage inflation, as measured by the change in the Average Hourly Earnings, held steady at 3.8%. As the employment report failed to influence Fed interest rate expectations in a significant way, Gold found it difficult to stage a rebound.
Heading into the weekend, the data from the US showed that the business activity in the private sector expanded at a healthy pace in November, with the S&P Global's preliminary Composite Purchasing Managers' Index (PMI) edging higher to 54.8 from 54.6 in October. As this report supported the USD, Gold remained in the lower half of its weekly range.
Gold investors to focus on Fed commentary ahead of blackout
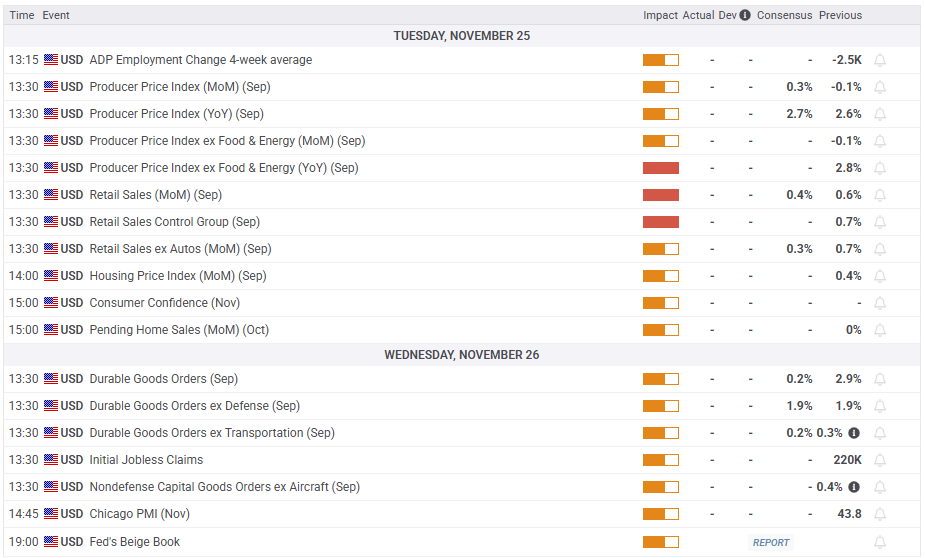
The US economic calendar will feature Retail Sales and Producer Price Index (PPI) data on Tuesday and the Durable Goods Orders report on Wednesday. However, these data are unlikely to trigger a significant market reaction because they will be for September, as part of the US Census Bureau and the BLS’s process of clearing the data backlog that built up during the Government shutdown.
The Conference Board will publish the Consumer Confidence Index data for November on Tuesday. In case the Present Situation Index of the survey, which is based on consumers’ assessment of current business and labour market conditions, declines sharply, the immediate reaction could hurt the USD and help XAU/USD edge higher.
Investors will pay close attention to comments from Fed policymakers before the blackout period starts on November 29. The market positioning suggests that there is room for additional USD strength in case Fed officials continue to voice their opposition against a rate cut in December. Conversely, Gold could gain traction if policymakers emphasize worsening labor market conditions and argue for another rate cut at the last policy meeting of the year.
Gold technical analysis
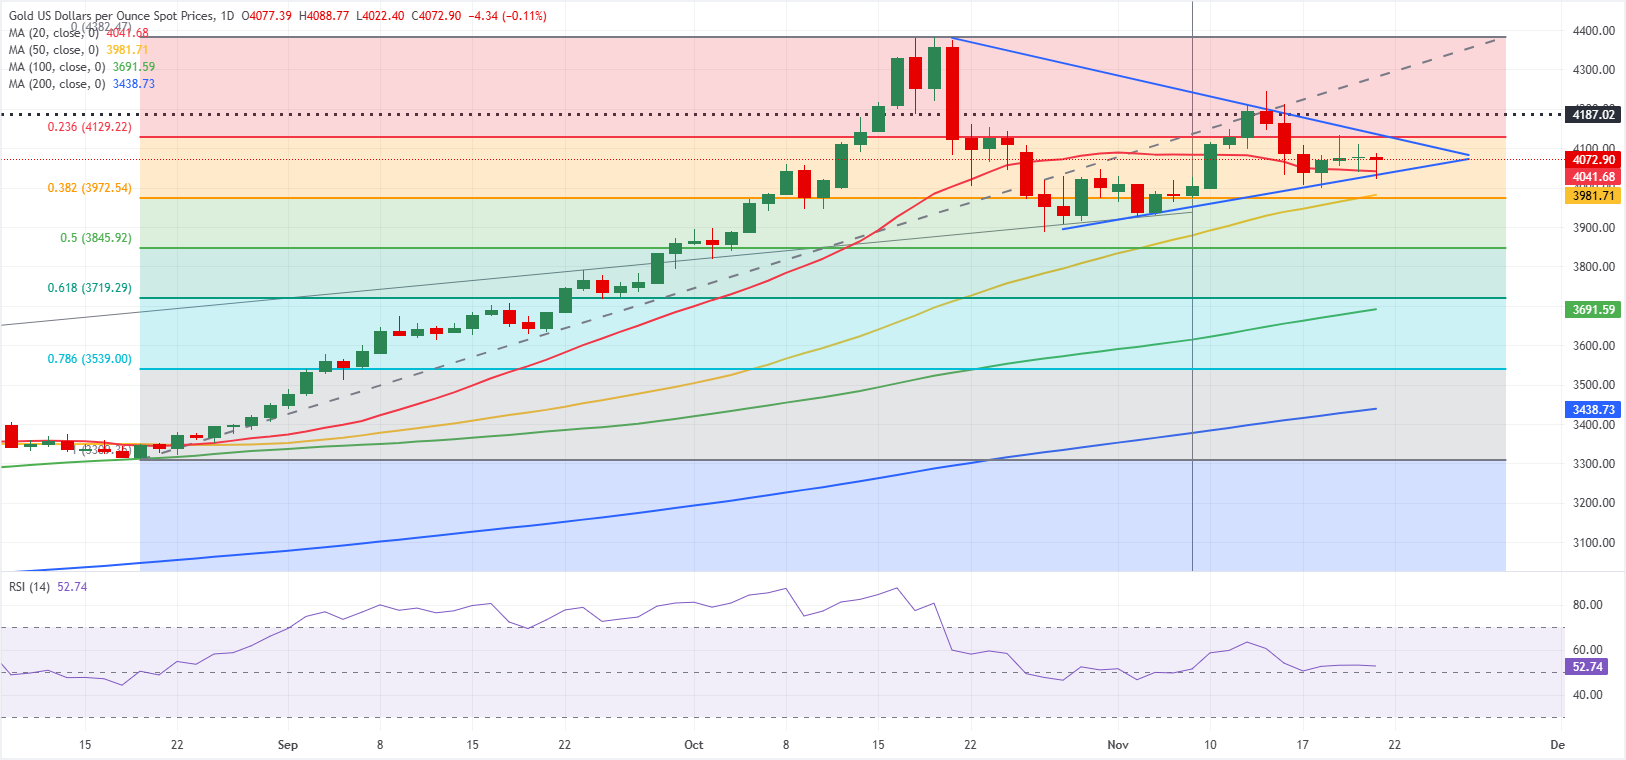
The technical outlook points to a neutral stance in the near term. On the daily chart, Gold fluctuates at around the 20-day Simple Moving Average (SMA) while trading within a symmetrical triangle pattern, and the Relative Strength Index (RSI) moves sideways near 50, reflecting the indecisiveness.
On the downside, the Fibonacci 38.2% retracement of the August-October uptrend and the 50-day SMA form the initial support area at $3,980-$3,970 before $3,900 (round level) and $3,845 (Fibonacci 50% retracement). Looking north, resistance levels could be spotted at $4,130 (Fibonacci 23.6% retracement, descending trend line), $4,245 (November 13 high) and $4,300 (round level).
US Dollar FAQs
The US Dollar (USD) is the official currency of the United States of America, and the ‘de facto’ currency of a significant number of other countries where it is found in circulation alongside local notes. It is the most heavily traded currency in the world, accounting for over 88% of all global foreign exchange turnover, or an average of $6.6 trillion in transactions per day, according to data from 2022. Following the second world war, the USD took over from the British Pound as the world’s reserve currency. For most of its history, the US Dollar was backed by Gold, until the Bretton Woods Agreement in 1971 when the Gold Standard went away.
The most important single factor impacting on the value of the US Dollar is monetary policy, which is shaped by the Federal Reserve (Fed). The Fed has two mandates: to achieve price stability (control inflation) and foster full employment. Its primary tool to achieve these two goals is by adjusting interest rates. When prices are rising too quickly and inflation is above the Fed’s 2% target, the Fed will raise rates, which helps the USD value. When inflation falls below 2% or the Unemployment Rate is too high, the Fed may lower interest rates, which weighs on the Greenback.
In extreme situations, the Federal Reserve can also print more Dollars and enact quantitative easing (QE). QE is the process by which the Fed substantially increases the flow of credit in a stuck financial system. It is a non-standard policy measure used when credit has dried up because banks will not lend to each other (out of the fear of counterparty default). It is a last resort when simply lowering interest rates is unlikely to achieve the necessary result. It was the Fed’s weapon of choice to combat the credit crunch that occurred during the Great Financial Crisis in 2008. It involves the Fed printing more Dollars and using them to buy US government bonds predominantly from financial institutions. QE usually leads to a weaker US Dollar.
Quantitative tightening (QT) is the reverse process whereby the Federal Reserve stops buying bonds from financial institutions and does not reinvest the principal from the bonds it holds maturing in new purchases. It is usually positive for the US Dollar.
Premium
You have reached your limit of 3 free articles for this month.
Start your subscription and get access to all our original articles.
Author

Eren Sengezer
FXStreet
As an economist at heart, Eren Sengezer specializes in the assessment of the short-term and long-term impacts of macroeconomic data, central bank policies and political developments on financial assets.


