Gold: Warsh flips the dot plot — Structure stays bearish as seller volume dries up at $4,122

1. Macro and fundamental backdrop
The June 13 cautiously bullish thesis has been invalidated. The reason is one meeting. Warsh chaired his first FOMC on June 16 to 17 and the dot plot delivered what the June 13 article flagged as the key risk scenario: the median projection shifted to show rates ending 2026 higher than today, reversing March's implied cut in a single session. Nine of nineteen officials now see at least one hike before year end. Seventeen of eighteen judged inflation risks tilted to the upside. The easing language that had been embedded in every statement for months was removed entirely. A unanimous 12 to 0 hold — but nothing else was unanimous.
That dot plot shift is structural, not a week of noise. It tells you the committee is no longer in a position where the next move could be lower. The dollar surged following the statement. The 2-year Treasury yield rose 2.25 percentage points on the day. Gold dropped $56 on the statement release and extended losses through Friday.
US and Iran:
An interim peace agreement between the US and Iran has driven oil prices sharply lower — a development that should, in theory, reduce the energy inflation component that pushed CPI to 4.2% in May. The fact that the dot plot went hawkish anyway tells you the Fed is no longer treating this as a purely energy-driven inflation story. The underlying pressure is broadening.
Central bank demand:
The World Gold Council reported that 45% of global central banks plan to add gold reserves, a record figure. China has accumulated for 18 consecutive months. That structural bid keeps $4,024 from becoming a collapse floor — but as this week demonstrated, it does not prevent sharp weekly losses when macro headwinds are this direct.
The macro picture is the most uniformly hawkish it has been since this selloff began. A dot plot flip, easing language removed, nine officials pricing a hike, and a dollar that has responded accordingly. Until the data forces a reversal in that narrative, the path of least resistance stays lower.
2. Technical structure — 4H primary timeframe
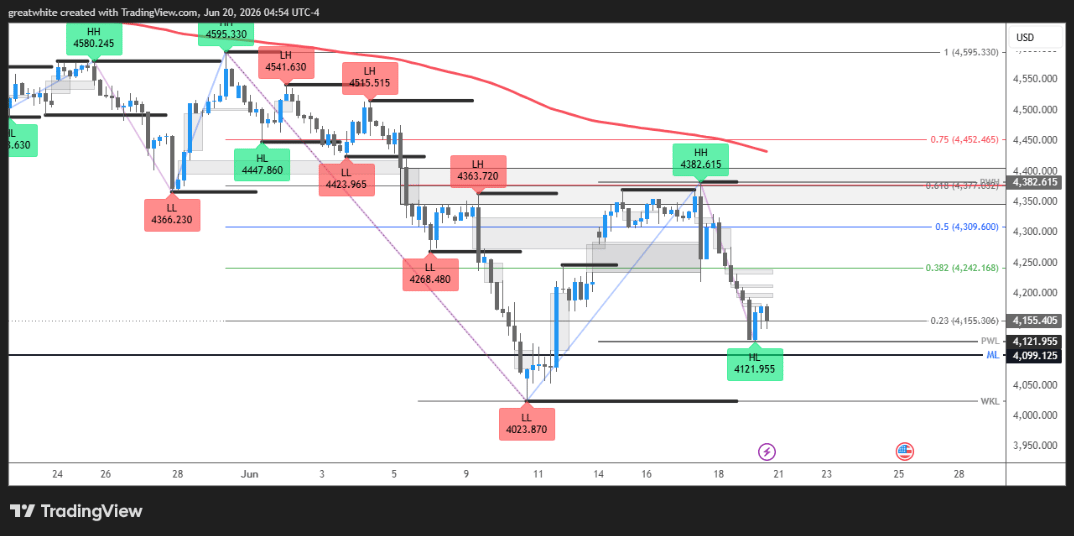
Gold is in no man's land — $31 below the nearest Fibonacci reference and $131 above the structural floor at $4,024. The prior bullish thesis has been fully reversed. Last week's hammer candle produced a single up-day on Tuesday, then five consecutive losses erased it completely. The June 13 article's breakout trigger at $4,242 never held as support. The week closed at $4,155.41, below the 0.236 Fibonacci level at $4,159, with the prior week's range spanning $4,121.96 to $4,382.62.
The sequence of three consecutive lower lows this week — Wednesday $4,219, Thursday $4,201, Friday $4,122 — requires a closer read than the price action alone suggests. Volume tells the other half: Wednesday's session ran on 812k contracts, Thursday's on 798k, Friday's on 426k. Seller participation dropped 47% from Wednesday to Friday. Price made a new low; the sellers behind it did not show up with the same conviction. That divergence does not confirm a reversal — Friday's bar closed near its low with no recovery wick, no engulfing structure, no hammer formation. But it is the prerequisite for one. When sellers push price to a new low on declining volume while approaching a major structural floor ($4,024), the setup for an absorption event is forming. The confirmation is still missing.
What the chart does show is that Friday's low at $4,122 sits technically above the June 11 base at $4,023.87 — making it a Higher Low on the daily timeframe. That is a single structural positive inside an otherwise bearish week. It means the floor has not been retested yet. The question entering the new week is whether that floor gets tested, and how it responds.
Market structure summary:
- Weekly: O $4,301.67 to C $4,155.41 — down $146 (3.4%). Jun 12 hammer candle fully erased.
- Three consecutive lower lows: $4,219 → $4,201 → $4,122, with volume declining 47% across the sequence
- Friday closed below the 0.236 Fibonacci at $4,159 — now in the $4,024 to $4,159 structural gap
- Friday's low at $4,122 is technically a Higher Low versus the June 11 base at $4,023.87
- $4,242 (last week's breakout trigger) is now major resistance — not tested from below
- Structural invalidation: daily close below $4,023.87 opens $3,950
Level | Type | Significance |
4,473.04 | 0.786 Fibonacci — Upper Resistance | Distant recovery target. Not relevant until structure above $4,377 is confirmed and accepted. |
4,377.03 | 0.618 Fibonacci — Key Resistance | Wednesday's intraday peak before the FOMC reversal. Significant supply zone; a failed attempt here triggered the most recent leg lower. |
4,310.00 | 0.500 Fibonacci — Lost Support | Prior equilibrium level, broken this week. Now resistance on any corrective recovery. |
4,242.17 | 0.382 Fibonacci — Major Resistance | Last week's breakout trigger that never held. Now the most significant resistance level in the current structure. Reclaiming this on a daily close changes the picture. |
4,201.00 | Thursday Low — Immediate Resistance | Broken support from Thursday's session. The first level price must clear on any recovery attempt before $4,242 becomes relevant. |
4,159.00 | 0.236 Fibonacci — Broken Support | The last Fibonacci reference above the floor. Friday closed below this level. Now immediate resistance; a 4H close back above it is the first bullish signal. |
4,155.41 | Current Price — Friday Close | Sitting in no man's land — $31 below the nearest Fibonacci reference and $131 above the structural floor. Decision point entering the week. |
4,122.00 | Friday Low — Structural Higher Low | Friday's session low. Technically a Higher Low versus the June 11 base at $4,023.87. Must hold to prevent a retest of the structural floor. |
4,099.13 | Monthly Low — ML Reference | Monthly structural low sitting just below Friday's low. A close below this level signals deeper structural deterioration. |
4,023.87 | June 11 Floor — Structural Base and Invalidation | The capitulation low from two weeks ago. A daily close below this level structurally collapses the current range and opens $3,950. |
3,950.00 | Extended Bearish Target | Next significant reference on confirmed structural failure below $4,024. Activated on a daily close below the June floor. |
3. Key zone analysis
Two zones define the week. The first is the $4,122 to $4,159 band — the gap between Friday's low and the broken 0.236 Fibonacci support. Price is sitting inside it. A daily close back above $4,159 is the first bullish signal; a break below $4,122 on a 1H close activates the bearish continuation toward $4,024. Nothing that happens inside this band is a trade signal. The band is the waiting room.
The second zone is $4,024. It is the June 11 capitulation floor and the structural base of the entire recovery attempt that began that week. Two weeks ago that level absorbed $196 in buying on the highest volume of the selloff. Whether that absorption holds on a second test — if one comes — is the most important price event of the coming weeks. A daily close below $4,024 is not a re-entry short; it is a structural reset that requires a full reassessment of every level below.
4. Scenario based trade framework
Scenario 1 — Bullish recovery (Conditional)
Trigger: Monday's low holds above $4,122 AND a 4H close above $4,159 occurs. Both conditions must be met. A close above $4,159 alone, if Monday first breaks $4,122 intraday, does not qualify.
Expected path: Hold above $4,122 → 4H close above $4,159 → $4,201 → $4,242
- Entry: Pullback to $4,130 to $4,160 after the 4H close above $4,159. Wait for the retest; do not enter on the breakout candle itself.
- T1: $4,201 — Thursday's low reclaim; structural repair signal
- T2: $4,242 — the 0.382 Fibonacci and prior major support cluster; the level that restores near term bullish conviction
- Stop: Below $4,100 — outside Friday's low and the Monthly Low at $4,099. A close below that level signals the recovery has failed.
- Volume requirement: The recovery candle above $4,159 must print above 500k. A close above $4,159 on 200k or less is a low conviction move and should not be traded.
Scenario 2 — Bearish continuation (primary risk)
Trigger: A 1H close below $4,122 — Friday's structural low. Monday's open will define whether this triggers immediately.
Expected path: $4,122 lost → $4,099 (Monthly Low) → $4,024 (June 11 floor retest) → $3,950 on daily close below $4,024
- Entry: $4,115 on a confirmed 1H close below $4,122. Do not anticipate; wait for the close.
- T1: $4,024 — June 11 structural base. Watch closely for absorption behaviour here before extending to T2.
- T2: $3,950 — activated only on a daily close below $4,024 with bearish expansion. Not assumed.
- Stop: Above $4,170 — a recovery back above that level signals the break below $4,122 was a wick sweep, not a structural break.
Scenario 3 — Extended structural recovery (low probability)
Trigger: A daily close above $4,242 — the 0.382 Fibonacci and the major resistance level that represents last week's failed breakout trigger. This is the level that structurally separates a bounce from a recovery.
Expected path: $4,242 accepted → $4,310 (0.500 fib) → $4,377 (0.618 fib — prior weekly high area)
- Entry logic: Do not enter on the initial close above $4,242. Wait for a retest of $4,242 from above on the 4H, with a confirming bullish candle establishing that former resistance is now support.
- T1: $4,310 — midpoint of the reanchored Fibonacci range
- T2: $4,377 — 0.618 retracement and the zone that rejected price on Wednesday's intraday fakeout
- Stop: Below $4,210 on the retest entry. A close back below that level signals the $4,242 break was not accepted.
- Probability: Low. The dot plot has shifted structurally. Nine FOMC members see a rate hike by year end. Easing language has been removed entirely. Getting from $4,155 to above $4,242 with conviction requires either a Fed communication reversal or a macro data shock — softer jobs data, a significant CPI undershoot, or a formal ceasefire that removes the inflation risk premium from oil. None of those is priced as a base case in the coming week.
5. Risk events and catalysts — Week of 22 June 2026
Fed speaker calendar
Multiple Fed officials are scheduled to speak this week in the aftermath of the June 17 meeting. Any communication that softens the dot plot's hawkish message — or conversely reinforces it — will move gold. Warsh himself is the one to watch. His first public comments after the FOMC will be parsed for whether the tone matches the projections or steps back from them.
US and Iran peace deal (ongoing)
The interim agreement has taken oil lower, which in theory should relieve the CPI headline. But the FOMC's hawkish dot plot despite lower oil suggests the committee has moved beyond treating this as a purely energy story. A formal ceasefire agreement removes the last geopolitical premium from gold; a breakdown reverses the oil move and adds back the inflation risk.
PCE data (late week)
The Fed's preferred inflation measure. A reading that shows core PCE softening meaningfully would be the first data-driven challenge to the hawkish dot plot — and gold's most credible near term catalyst for a recovery above $4,242.
6. Summary and directional bias
Gold is sitting in no man's land between the broken 0.236 Fibonacci at $4,159 and Friday's structural low at $4,122 — with the June 11 floor at $4,024 as the only meaningful reference below. The FOMC dot plot delivered the hawkish scenario flagged in the June 13 article as the primary risk, and the market responded directly: the Jun 12 hammer candle was fully reversed, three consecutive lower lows printed, and every level from $4,242 downward has been lost.
The one signal worth monitoring is the volume sequence at the lows: Wednesday 812k, Thursday 798k, Friday 426k. Sellers pushed to new lows with declining participation. That is not a reversal signal — Friday's bar closed near its low with no bullish candle structure. But declining seller volume approaching a major floor is the precondition for absorption. If Monday holds above $4,122 and a 4H close above $4,159 follows, the recovery path toward $4,201 and $4,242 opens. If $4,122 breaks on a 1H close, the June 11 floor at $4,024 gets tested for the second time.
BULLISH ABOVE | NEUTRAL BETWEEN | BEARISH BELOW |
4,159.00 0.236 fib reclaimed; first bullish signal active | 4,122 – 4,159 No man's land; await directional daily close | 4,122.00 Friday low lost; retest of $4,024 opens |
Author

Martin Nwankwo
TradingPRO
Technical Market analyst with over a decade of forex experience, an ICT chartered student.


