Gold threatening to nudge beneath 200-day SMA

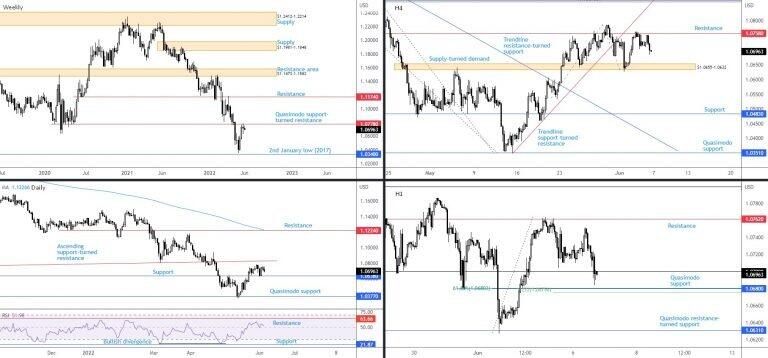
EUR/USD
Europe’s shared currency remains rooted within a primary bear trend (weekly scale), in addition to price shaking hands with the lower side of a heavy-duty weekly Quasimodo support-turned resistance at $1.0778. 2nd January low at $1.0340 (2017) appears a reasonable downside objective should sellers take the wheel.
While weekly price scans resistance, price action on the daily timeframe rebounded from support at $1.0638 last week. Overhead, a daily ascending support-turned resistance, drawn from the low $1.0340, is seen. For that reason, technicians cannot rule out the possibility of a short-lived ‘pop’ higher to test the ascending line before sellers make an impression. Out of the daily chart’s relative strength index (RSI), we continue to view support from the 50.00 centreline (positive momentum).
Against the backdrop of higher timeframe structure, the blend of H1 resistance at $1.0762 and H4 resistance from $1.0758 capped upside efforts in recent movement. Subsequent action on Monday led H1 price south of $1.07 to within a whisker of Quasimodo support at $1.0680 (and a 61.8% Fibonacci retracement as well as a 1.272% Fibonacci projection at $1.0676).
With that being said, another whipsaw through $1.07 could still be on the menu to entice a bid from the H1 Quasimodo support. Drilling through the aforementioned H1 levels, on the other hand, unbolts the door to a bearish scenario (in line with weekly structure), targeting H4 supply-turned demand at $1.0655-1.0632 and H1 Quasimodo resistance-turned support from $1.0631.
AUD/USD
It was a quiet session for AUD/USD Monday, closing mostly unchanged.
For those who read previous analysis, therefore, you may recall the following on the weekly and daily timeframes:
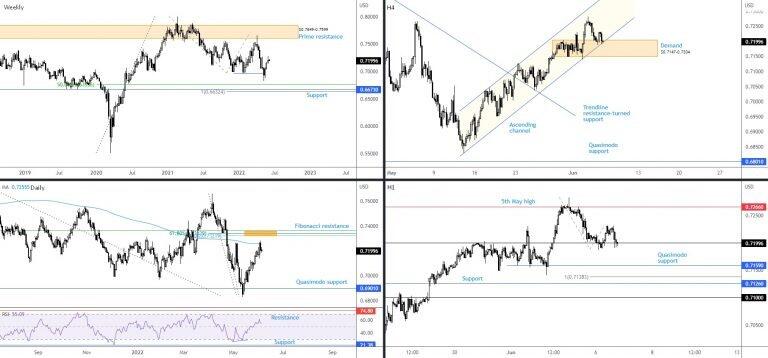
The Australian dollar eked out a third successive weekly gain versus the U.S. dollar last week, following a lower low that breached 28th Jan $0.6968 low on the weekly. While an extended pullback is on the table, this remains a sellers’ market in observance of a clear downtrend since August 2011 (check monthly scale) and weekly flow topping at $0.8007 in early February 2021. Weekly support structure remains between $0.6632 and $0.6764, comprised a 100% Fibonacci projection, a price support, and a 50% retracement.
A closer reading of price action on the daily timeframe has buyers and sellers battling for position around the 200-day simple moving average at $0.7256. Although sellers had the edge on Friday, Fibonacci resistance between $0.7364 and $0.7322 merits consideration. Adding to the technical landscape on the daily, the relative strength index (RSI) cemented position north of its 50.00 centreline (positive momentum) and direct the technical headlights towards indicator resistance at 74.80 (nestled within overbought territory).
As we write on the H4 timeframe, demand from $0.7147-0.7204 is active on the H4, joined by H4 channel support, taken from the low $0.6829. Should this area cede ground, this adds weight to the bearish position visible on the higher timeframes.
Lower on the curve, H1 is dipping a toe under $0.72, signalling bearish intent towards H1 Quasimodo support from $0.7159, followed by a 100% Fibonacci projection at $0.7138 and support at $0.7126.
With the above notes taken on board, a decisive move south of $0.72 could be sufficient to draw a bearish scene.
USD/JPY
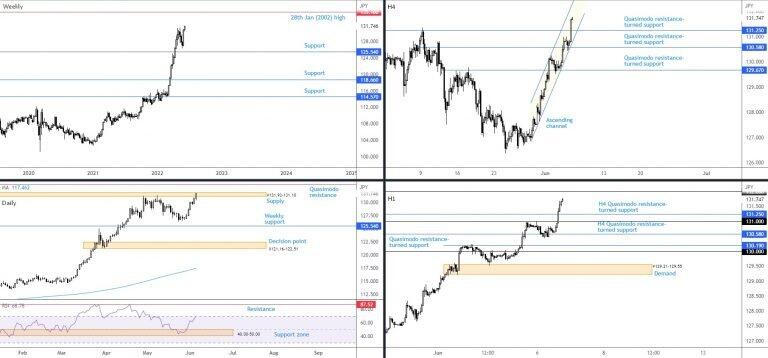
USD/JPY powered higher Monday, adding 0.7 per cent and refreshing multi-year pinnacles. Further buying—supported by the primary bull trend since 2021—exposes ¥135.16: 28th January high (2002) on the weekly chart. To the downside on the weekly timeframe, support at ¥125.54 also warrants attention.
Consequent to spirited demand on Monday, supply from ¥131.93-131.10 is under attack on the daily timeframe. Engulfing this area bolsters the pair’s bullish vibe on the weekly scale and opens the curtains on daily Quasimodo resistance at ¥133.45. From the daily chart’s relative strength index (RSI), we can see that following a strong rebound from 40.00-50.00 support (an area representing a ‘temporary’ oversold zone since May 2021), the indicator is within reach of overbought space. As a result, indicator resistance is likely on the radar at 87.52, fixed within overbought space.
H4 Quasimodo resistance-turned support at ¥130.58 did a good job of holding back sellers on Monday. Subsequent action cruised above another Quasimodo resistance from ¥131.25, offering market participants another support to consider if retested, which is also featured on the H1 timeframe. ¥132 will be a consideration on the H1 chart as possible resistance, along with H4 channel resistance, pencilled in from the high ¥130.13.
Having seen the weekly timeframe eyeballing higher prices, and H4/H1 timeframes poised to nudge higher, another wave of buying may unfold and take on daily supply at ¥131.93-131.10. Though, before additional upside materialises, a retest of ¥131.25 on the H4 could develop and deliver a platform for dip-buyers.
GBP/USD
In spite of U.K. Prime Minister Boris Johnson’s Confidence Vote, sterling was bid against its US counterpart on Monday. The general picture of GBP/USD, however, remains negative, entrenched within a muscular primary downtrend since early 2021. Weekly resistance at $1.2719 also clouds current price action, in association with daily trendline resistance (etched from the high $1.3639) and daily Quasimodo support-turned resistance from $1.2762. Higher timeframe downside objectives, therefore, target weekly Quasimodo support from $1.2164, closely shadowed by daily support from $1.2018. One final point on the daily timeframe, one which supports a bearish showing, is the relative strength index (RSI), visibly seen struggling to find a reception above the 50.00 centreline.
H4 resistance between $1.2686 and $1.2614, made up of a number of technical resistances, remains in position. Consequently, H4 support is watched at $1.2375. From the H1 timeframe, $1.26 and $1.25 are in sight. Beyond $1.26, resistance resides between $1.2627 and $1.2609, which may be an area we see price welcome a whipsaw north of $1.26.
Below $1.25 points to support around $1.2475 (yellow). Downstream, beyond the aforesaid supports, sellers could target $1.24 on the H1 (conveniently aligns closely with H4 support at $1.2375).
-637901495674420613.jpg)
BTC/USD
Despite a number of downside attempts on BTC/USD since mid-May, as well as a clear-cut primary bear trend (since 2021), support on the daily timeframe continues to survive at $28,849. $36,361 and $34,048 (daily) resistances, therefore, are primed to entertain price. A $28,849 break will continue to be a concern for any buyers in this market, having observed limited support until the $20,000 neighbourhood.
Based on the H1 scale, Monday saw BTC outperform versus the buck, overthrowing $30,485-30,861 resistance and resistance at $31,000, both of which now represent support as we step into Tuesday. Upstream shifts attention to resistance at $32,153.
Given the current assessment of price action, knowing daily price continues to defend support at $28,849, a retest of H1 support between $30,485 and $31,000 could be enough to inspire a bullish state, targeting at least H1 resistance from $32,153.
-637901495594432267.jpg)
Gold (XAU/USD)
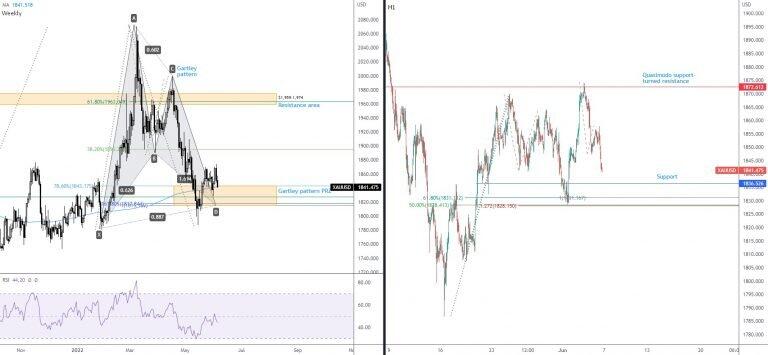
As noted in recent writing, buyers continue to struggle to find a foothold out of the daily harmonic Gartley pattern’s PRZ (Potential Reversal Zone) between $1,815 and $1,843. Daily flow made its way to the upper side of its 200-day simple moving average at $1,841 on Monday. Breaking through the SMA is likely a concern for XAU/USD longs. Also adding to the somewhat bearish presence emerging from the daily chart, the relative strength index (RSI) has failed to break above the 50.00 centreline: negative momentum. Upside price targets, nevertheless, remain noted at $1,896 (38.2% Fibonacci retracement derived from legs A-D of the current harmonic pattern) and a $1,959-1,974 resistance zone.
Coming from the H1 timeframe, price is on track to welcome support at $1,836, which is located closely to an area of Fibonacci support from between $1,828 and $1,831.
Outlook unchanged
According to the primary trend, we are in the early stages of a bear market. Ultimately, though, if the daily chart’s Gartley pattern holds and entices buying, this may attract further bids. As such, H1 supports between $1,828 and $1,831 are likely to monitored.
Author

Aaron Hill
FP Markets
After completing his Bachelor’s degree in English and Creative Writing in the UK, and subsequently spending a handful of years teaching English as a foreign language teacher around Asia, Aaron was introduced to financial trading,


