Gold, the Chart of the Week: XAU/USD is coiled and breakout eyed
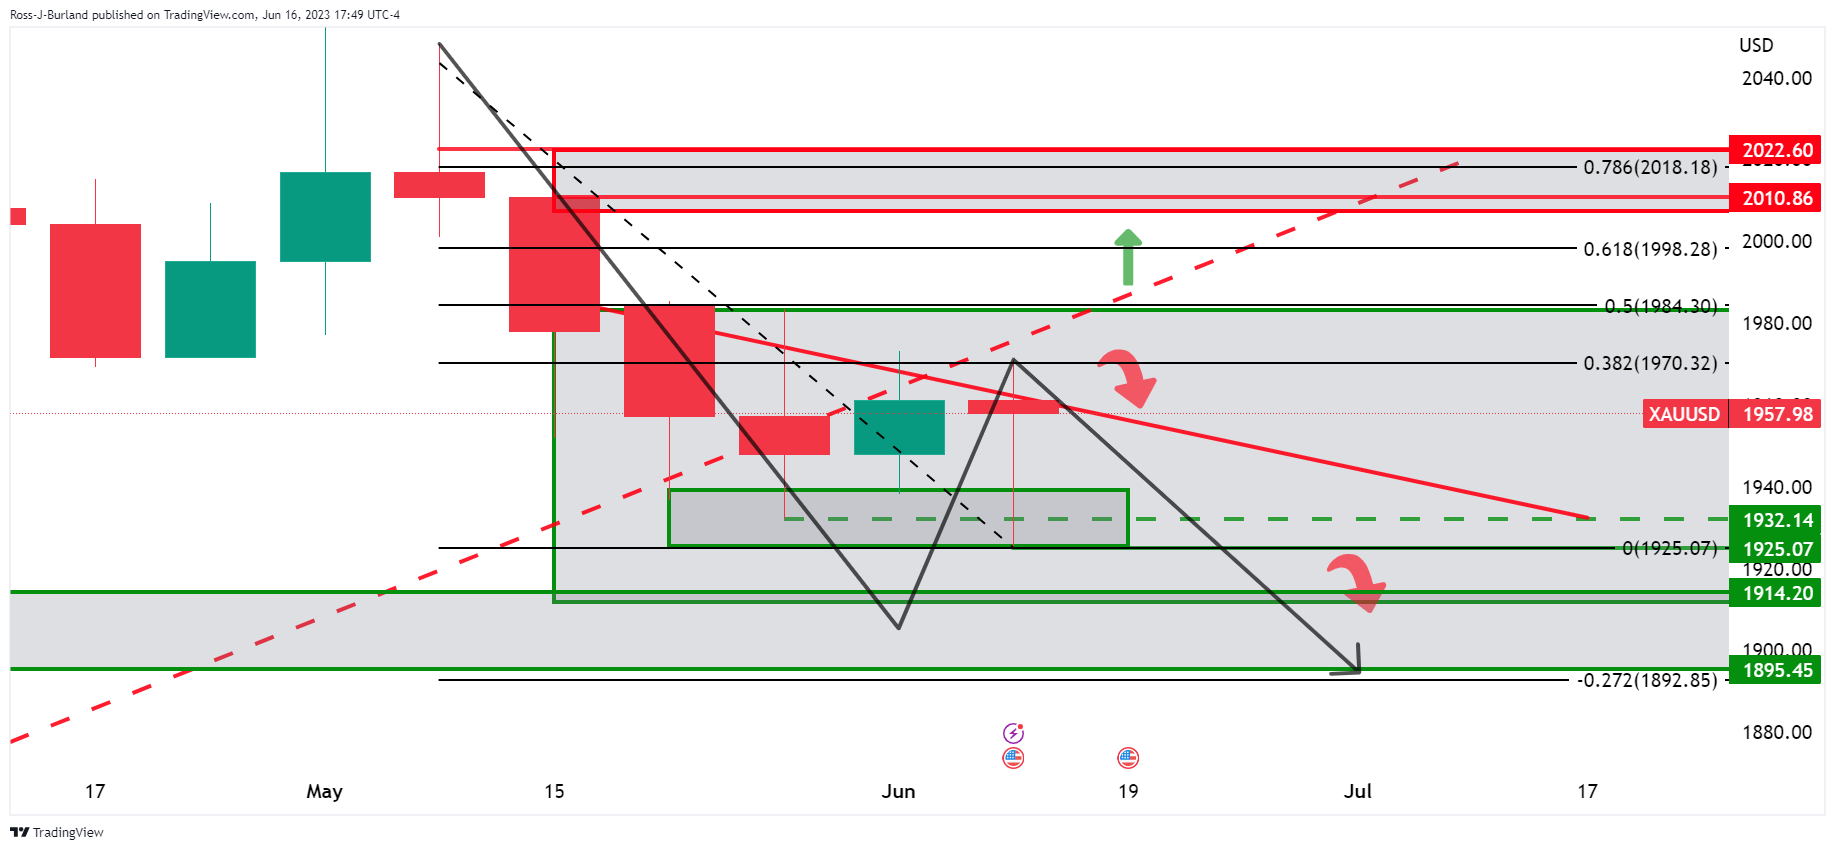
- Gold is under pressure while below the daily trendline but bulls eye a break higher.
- Bears eye $1,930s to open risks of a bearish extension.

Gold prices rose for a third-straight session posting a minor gain on Friday although we are at a critical resistance area on the daily charts as the following will illustrate.
From a top-down perspective, there are mixed outlooks.
Gold monthly chart

The monthly chart is bearish and bears eye the 61.8% Fibonacci target.
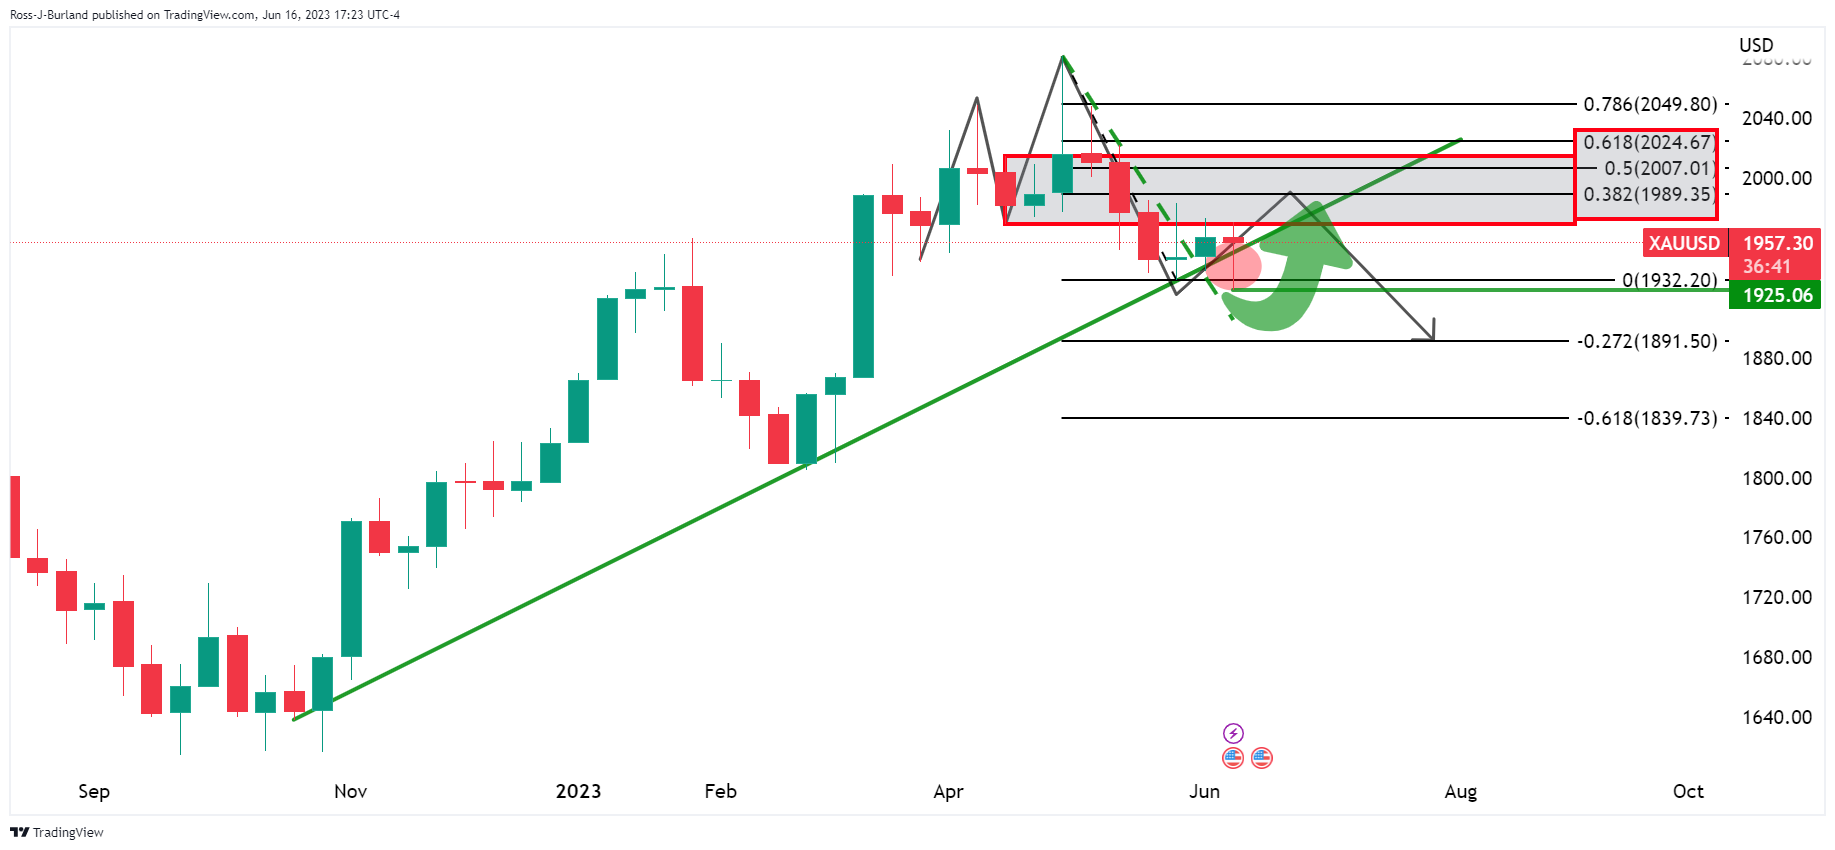
Bulls, however, might be encouraged by the neckline of the M-fibonacci that is yet to be tapped where the 38.2% Fibos comes in.
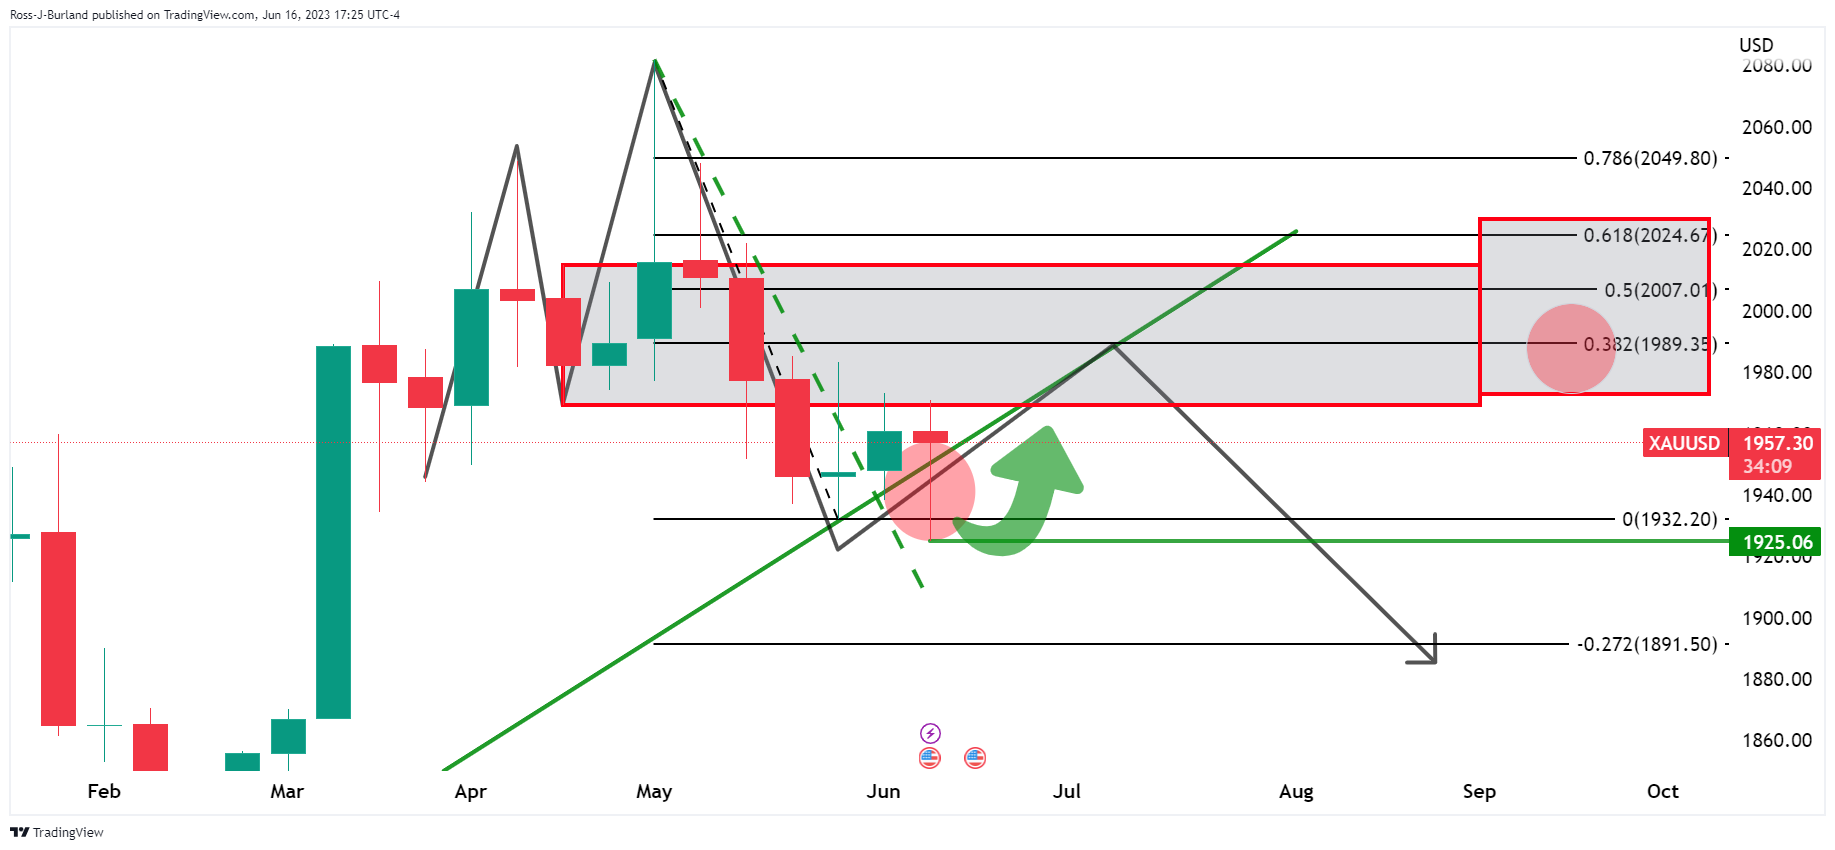
Gold weekly chart
On the other hand, there are prospects of a move lower while the price is on the front side of the bearish trendline on the daily chart.
Premium
You have reached your limit of 3 free articles for this month.
Start your subscription and get access to all our original articles.
Author

Ross J Burland
FXStreet
Ross J Burland, born in England, UK, is a sportsman at heart. He played Rugby and Judo for his county, Kent and the South East of England Rugby team.


