Gold, the Chart of the Week: XAU/USD breakout traders triggered in, bear traps being laid down
- Gold price is pulling in trend-followers which could equate to some meanwhile pain for fresh shorts.
- A correction could be on the cards for the initial balance of the week in the Gold price.
- Fed speakers will be crucial this week following the NFP numbers.

Gold price ended sharply lower on Friday, rocking the Gold price bugs that had been otherwise delighted with the dovish tolt at the Federal Reserve just a couple of days prior. There was an unexpectedly robust rise in US employment last month despite the prelude data events earlier in the week such as the ADP report. The surprise sent the US Dollar on a tear, sinking all other ships including the Gold price into a build-up of length that had accumulated over some 1000 pips of a rally from the start of the year.
Gold price ended lower by 2.45% and had fallen from a high of $1,918.55 to a low of $1,861.34, although still some way off the January lows of $1,8125.06. However, we could now have a high in place for the foreseeable future at $1,959.67 as we came crashing through last week;'s lows of $1,900.70 and subsequently, the follow-through in Friday's sell-off has broken critical structures and trendline supports triggering breakout traders and new trend followers into the market as they challenge the uptrend support driven by the recent central bank buying-binge.
Taking a quick glance at the drivers that have accumulated into expectations that the Federal Reserve will need to continue raising interest rates to slow the economy, the United States added 517,000 jobs in January, far more than the average analyst estimate for a 187,000-job rise and despite rising interest rates. The data will be put under scrutiny this week.
There will be follow-up commentary from various Federal Reserve officials including the man himself and the chairman of the central bank, Jerome Powell where traders will be looking for more commitment to the dot plot than what was seen or heard from in last week's Fed statement and subsequent presser. Fed's Williams, Waller and other officials will likely echo Mary Daly post data comments:
Fed prepared to do more.
Rate decisions will depend on inflation.
Too early to talk about what we will do meeting by meeting.
Directional policy is for additional tightenings.
Far too early to declare victory, or a peak.
Will need to be in restrictive policy stance until truly believe inflation will come down to 2%.
Gold technical analysis
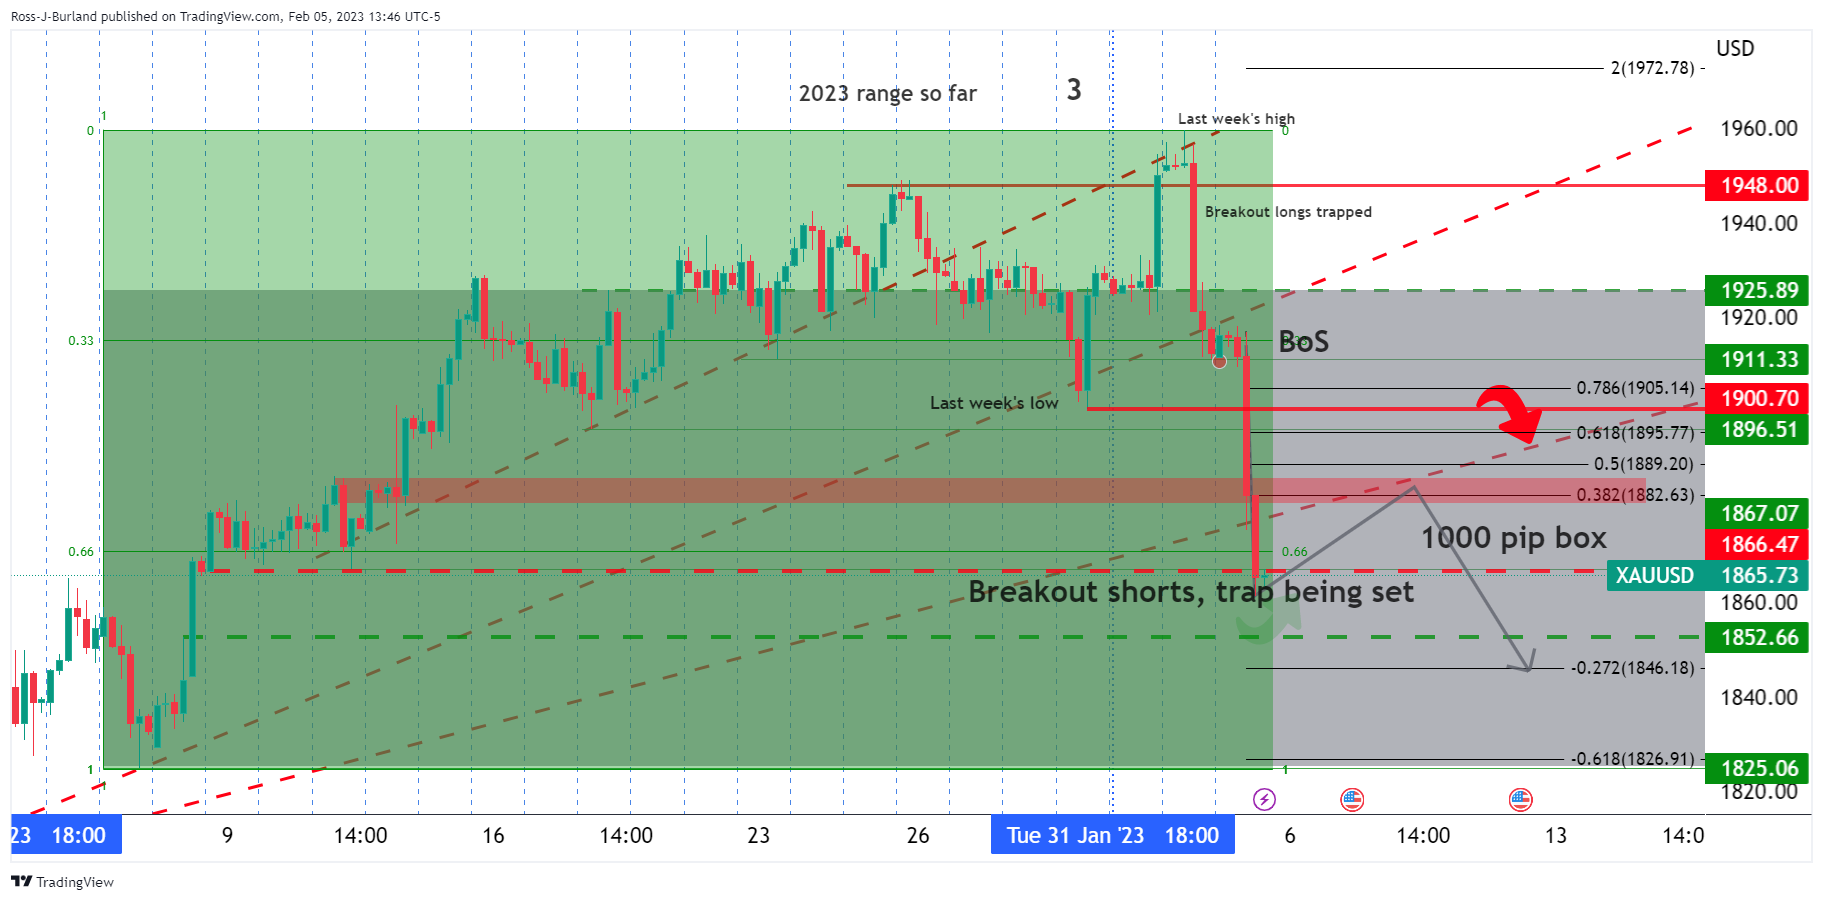
(H4 chart)
We could be seeing the makings of a bear trap as per the above analysis on the 4-hour chart. Yes, the move to the downside was strong and yes we have broken various layers of structure, but we are yet to see a decisive build-up of shorts below the dominant longer-term trendline as of yet.
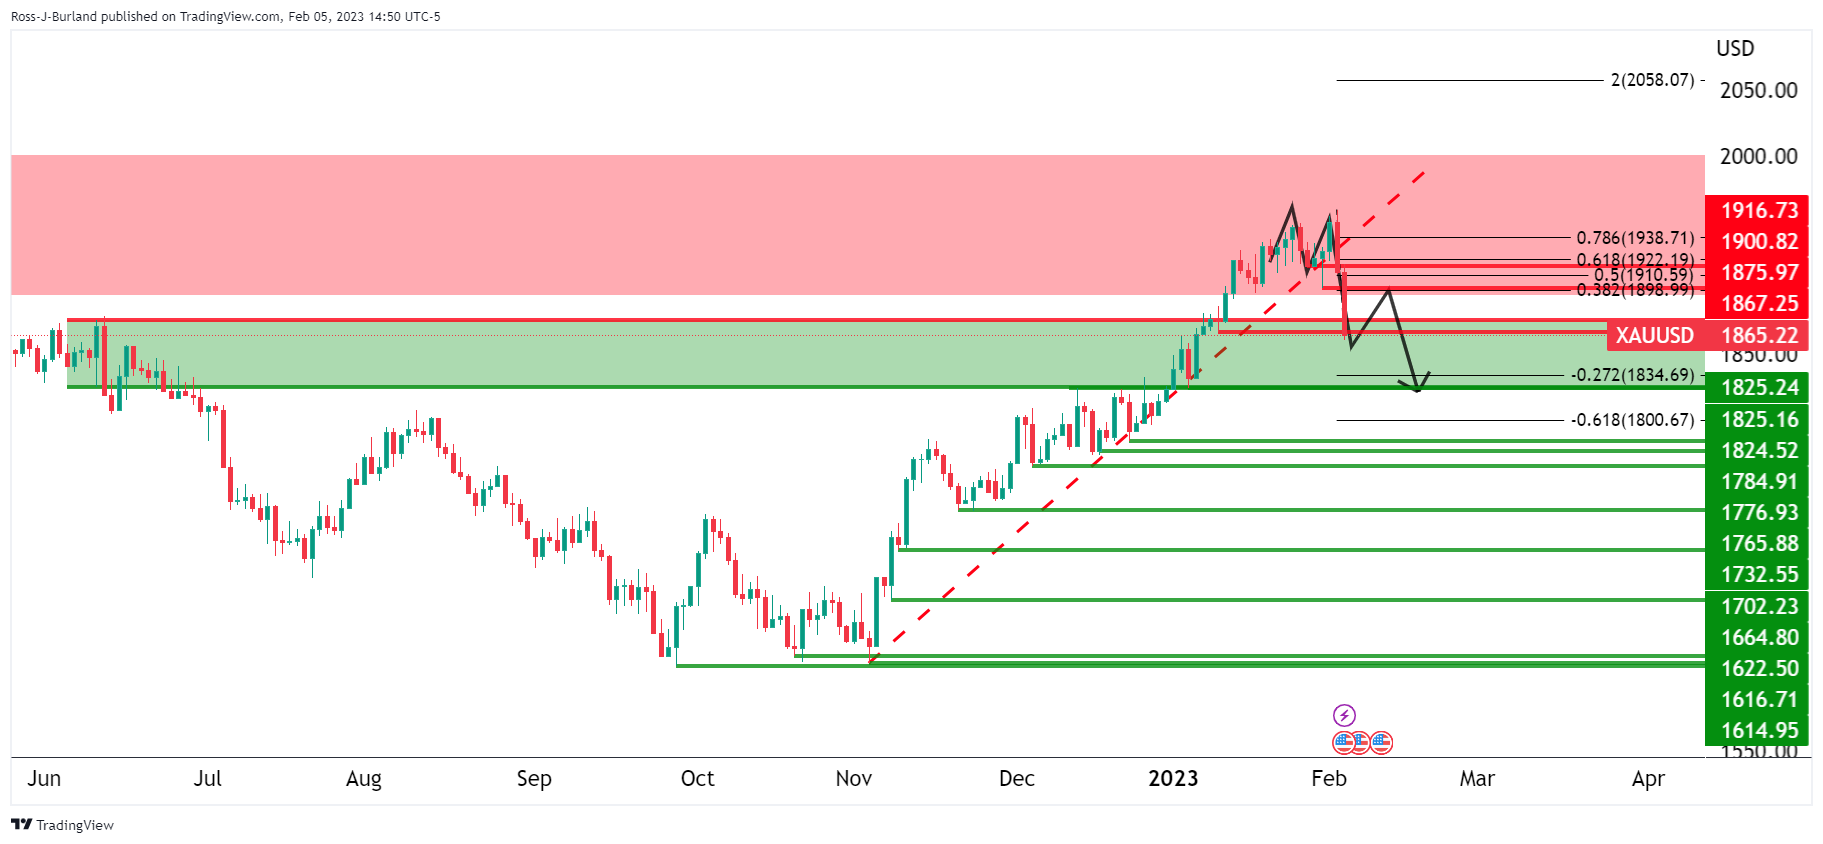
(Daily chart)
As we can see, we have an M-formation formed on the daily chart, a reversion pattern and we should expect to see a retracement, at some point, in time. That is not to say we will see an immediate one, but there could be some price discovery at this juncture if not a full-on correction and unless there is a set-up, it is best to steer clear of such a phase, aka the ''barroom braw'':
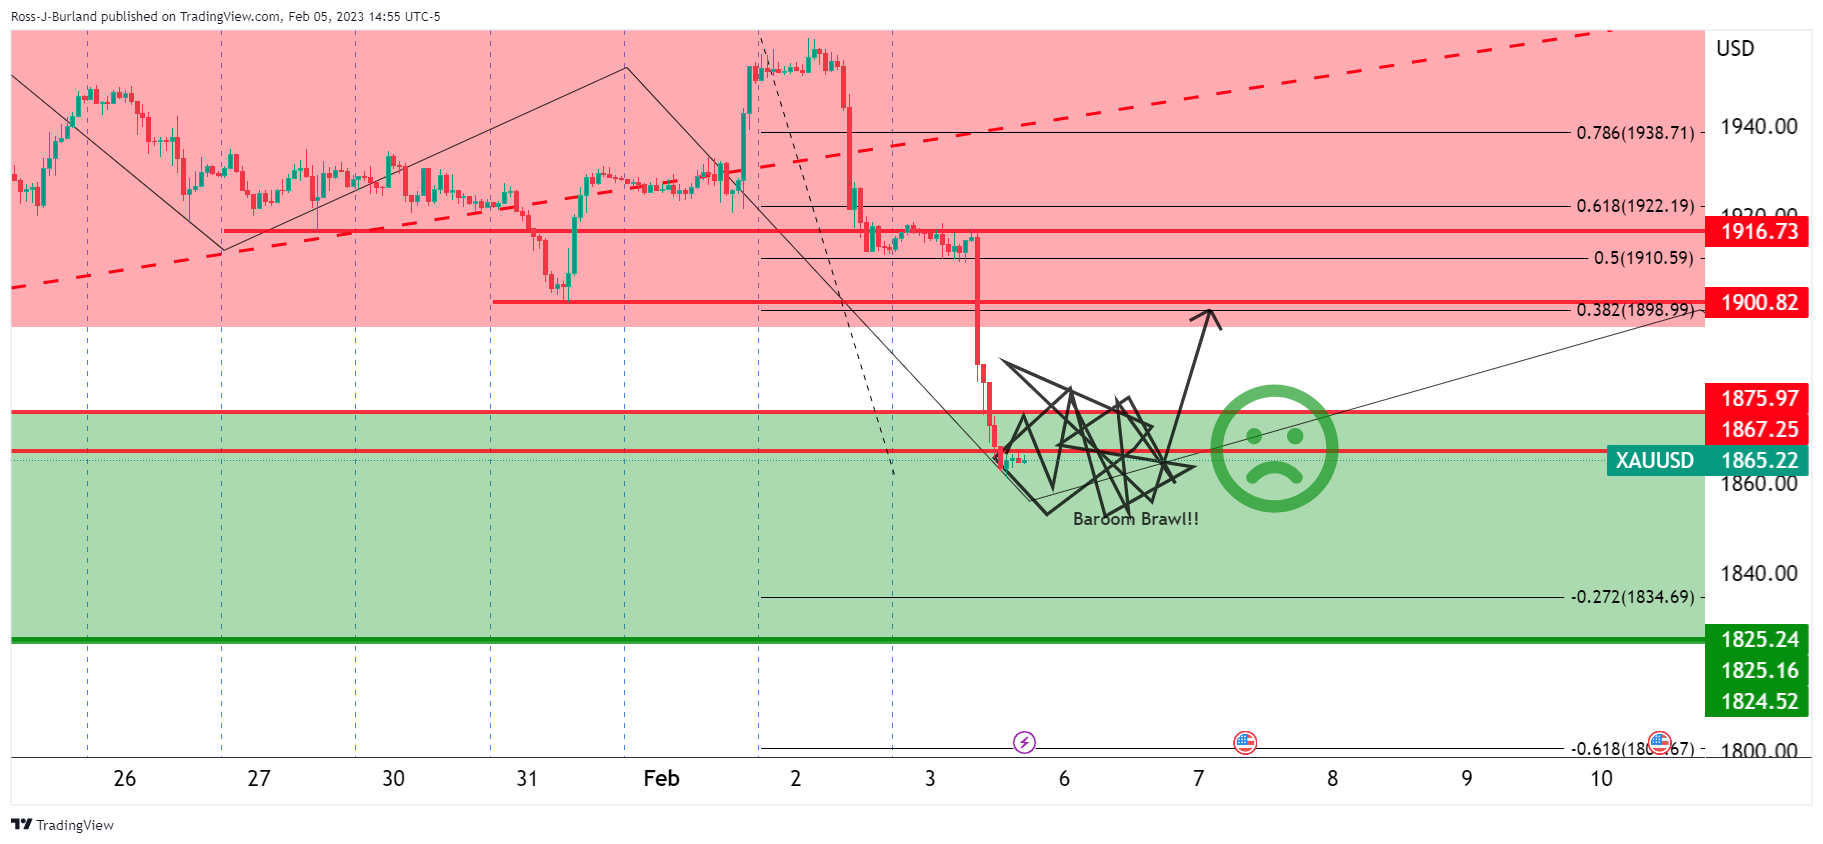
(H1 chart)
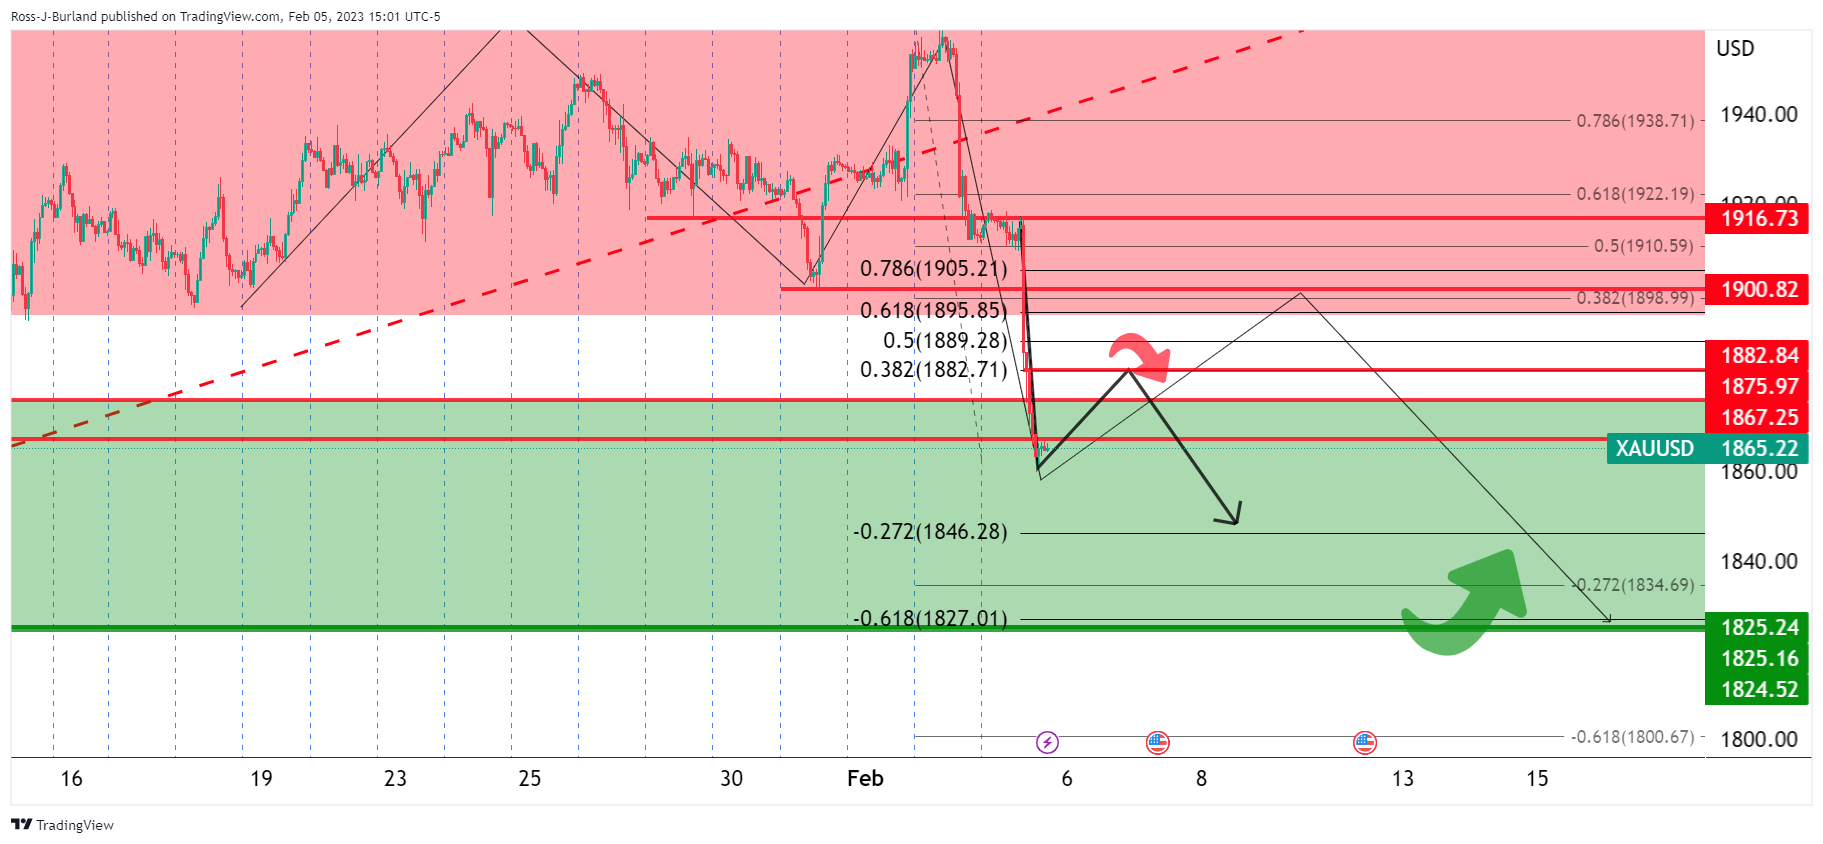
However, should there be a steady bullish retracement into, say, an hourly 38.2% Fibonacci retracement on the hourly bearing impulse, then there could be an opportunity on the short side to then target the round $1,850 and finally to the $1,820s:
Author

Ross J Burland
FXStreet
Ross J Burland, born in England, UK, is a sportsman at heart. He played Rugby and Judo for his county, Kent and the South East of England Rugby team.