Gold, the Chart of the Week: XAU/USD bears could be about to move in for the kill
- Gold's hourly trendline support has been breached below a double top on the chart.
- Structure in the 50s guards a sell-off for the opening sessions.

Gold ended the day on Friday flat following a firm correction to end the week with bulls moving in on the prior support structure found in the middle of the month near $1,660 afforded by the latest slump in USD. However, as the new quarter embarks, fundamentalists will be weighing in with speculation over the next stage of the
Federal Reserve's hiking cycle and this could be a weight for the price of gold in the coming days.
''Considering the increase in inflation's persistence this cycle, a restrictive regime may last longer than historical precedents with the Fed likely to keep rates elevated for some time, even as recession risks rise, which argues for a prolonged period of pronounced weakness in precious metals,'' analysts at TD Securities argued.
Meanwhile, as for technicals, should the bears commit at this juncture, the downside thesis will be firmly back in play as the following analysis illustrates:
Gold daily chart

From a daily perspective, we have the aforementioned resistance in play, an old critical support structure that would be expected to play a key role over the coming sessions. Should this hold, any hopes by the bulls that are already feeling the heat of the failed breakout will be all but dashed into the new month. There is considerable risk of a significant downside continuation while below $1,680 as per the following weekly chart:
Gold weekly chart
The price has been rejected at an important support level near $1,645 following the sharp recovery from the recent $1,615s. Going by the volume profile of the March-August 2020 range, there is little prospect of a bullish scenario as the price melts into a void of liquidity.
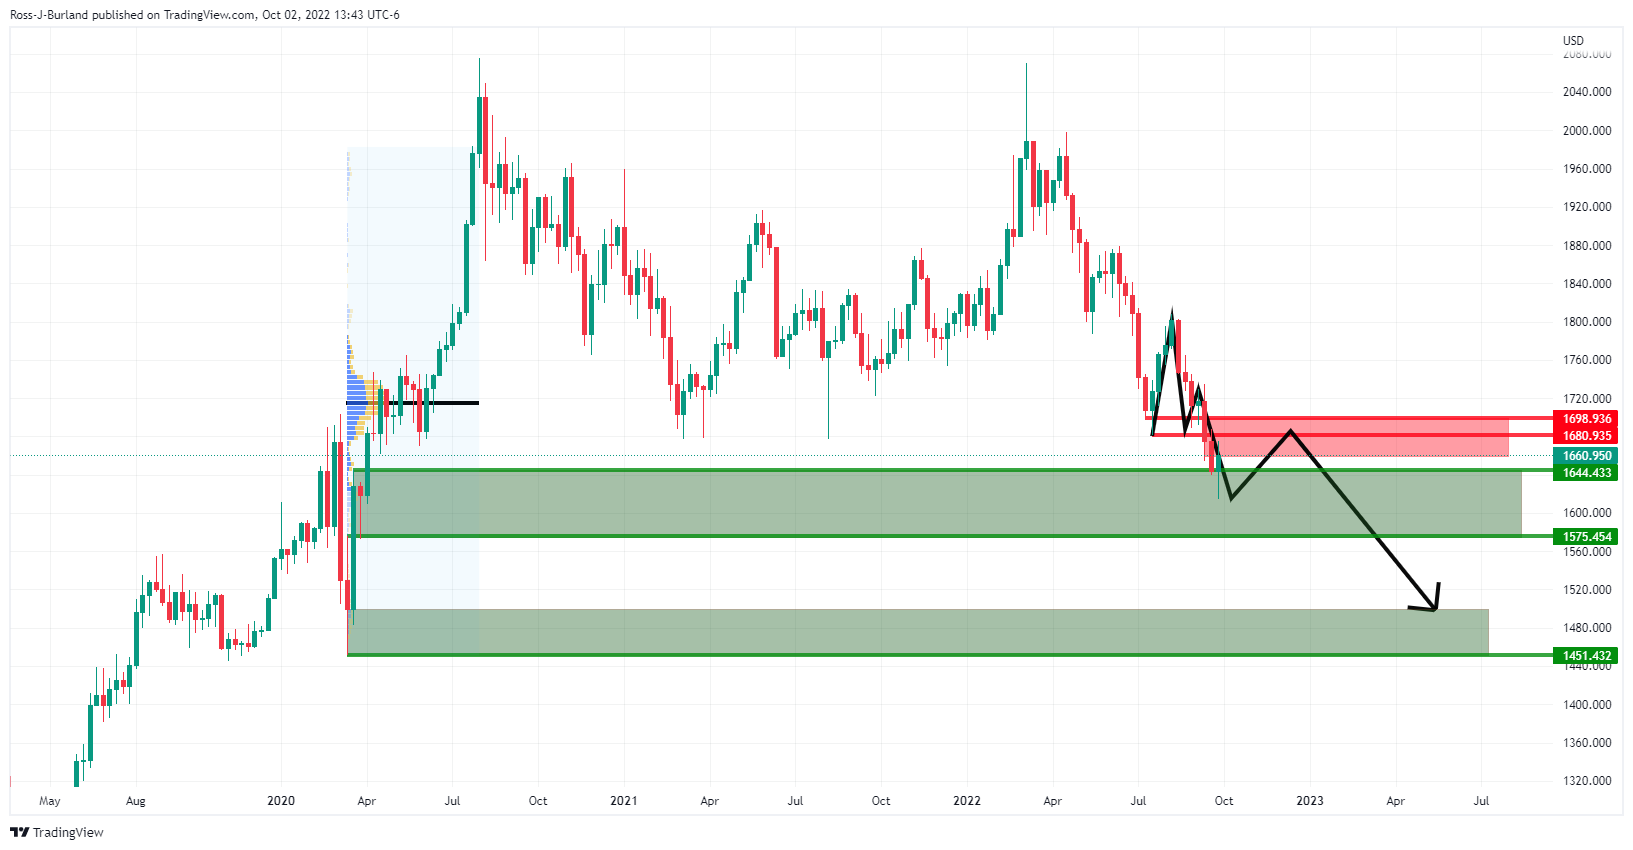
Gold H1 chart

Meanwhile, from a nearer-term perspective, we have prospects of an imminent bearish breakout. The trendline support was breached following a peak formation and a second attempt of the hourly highs failed, leaving a double top on the chart. Structure in the 50s guards a sell-off for the opening sessions. A retest of the neckline of the M-formation will be telling in this regard.
Premium
You have reached your limit of 3 free articles for this month.
Start your subscription and get access to all our original articles.
Author

Ross J Burland
FXStreet
Ross J Burland, born in England, UK, is a sportsman at heart. He played Rugby and Judo for his county, Kent and the South East of England Rugby team.


