Gold, The Chart of the Week: $1,880's are eyed as last defense for continued upside
- The Bulls burst through critical daily resistance.
- Bears need a weekly close below $1,830.

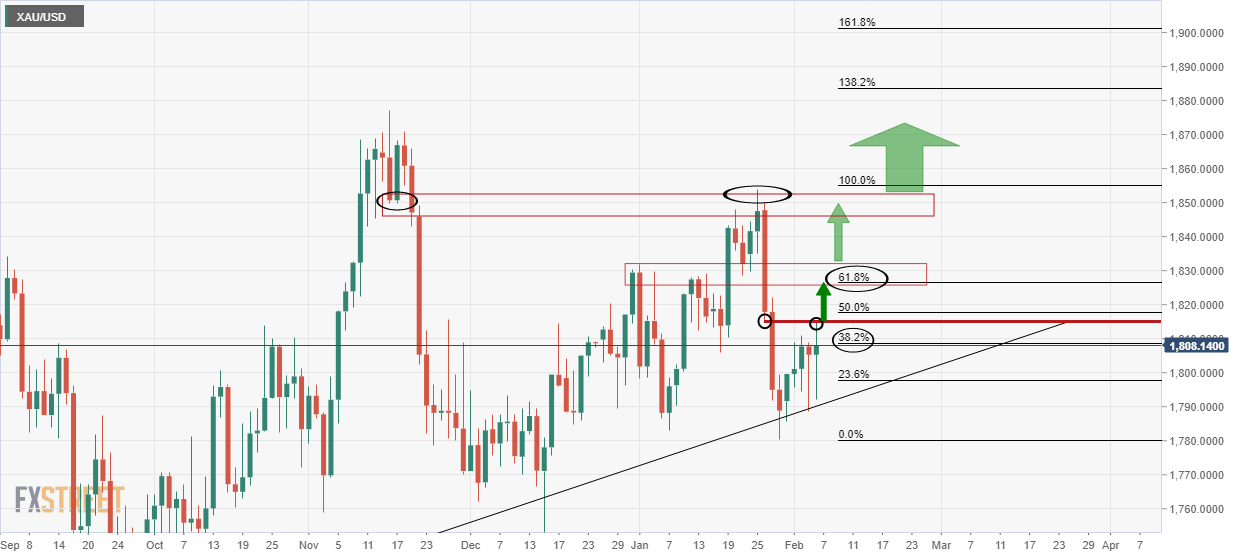
As per last week's analysis, Gold, Chart of the Week: Bulls take on the 38.2% Fibo, now eye the 61.8% golden ratio, the price respected the neckline of the M-formation initially and then the bulls took control again taking the price to a fresh daily high on Friday.
Risk aversion spiked late in the New York session as the US warned its citizens to leave Ukraine within 48 hours due to Russian invasion risks. This sent Wall Street into a tailspin and sent the US 10-year Treasury yields crashing below daily support from 2.061% to a session low of 1.915%. The greenback remained in positive territory in the 96 areas, DXY. However, for its haven allure, gold buyers emerged and the following illustrates past and prospective price action in a top-down analysis.
Gold, daily chart, prior analysis
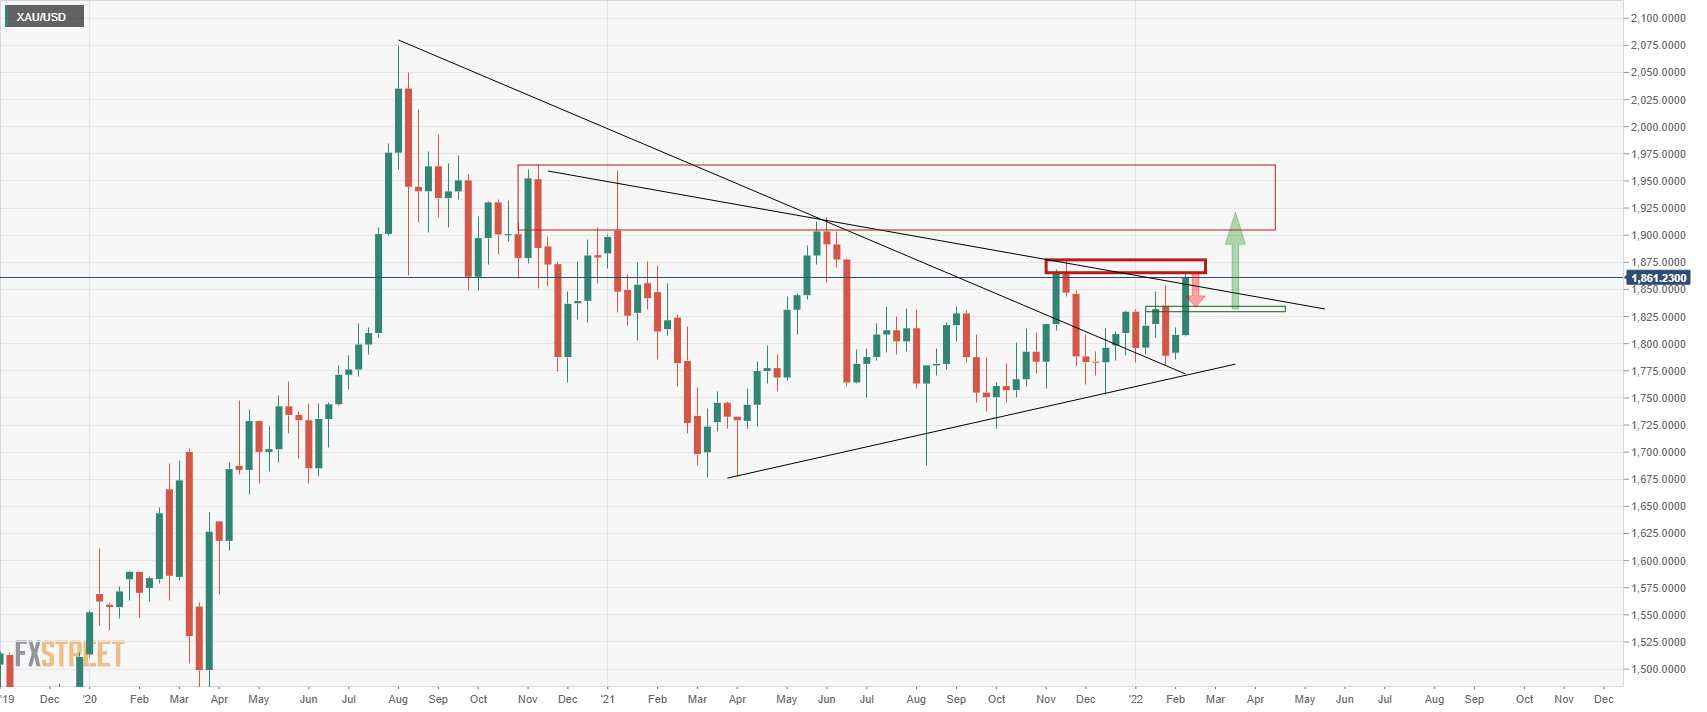
Gold live market
The price respected the highlighted levels in last week's analysis and would now be expected to adhere to the overhead resistance with $1,880 as the last defence to a breakout.
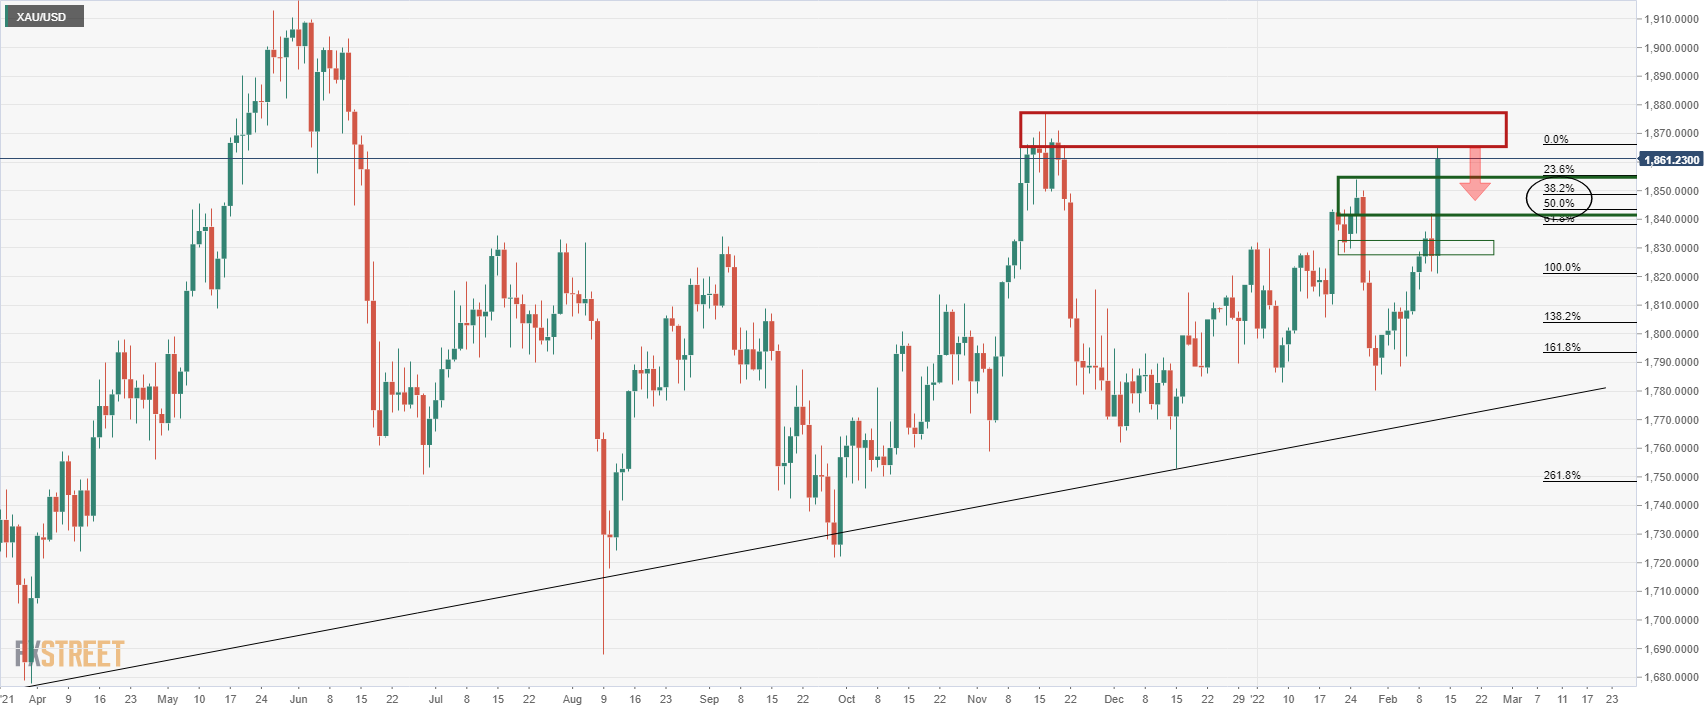
Gold weekly chart
If the bears manage to take over control, the 38.2% ratio and 50% mean reversion levels between $1,850 and $1,840 guards a run into the low $1,830's. However, the bears will not be out of the woods until a weekly close below there.
Author

Ross J Burland
FXStreet
Ross J Burland, born in England, UK, is a sportsman at heart. He played Rugby and Judo for his county, Kent and the South East of England Rugby team.


