Gold struggles below $3,450 as Fed rate cut bets and labour data awaited

Gold is struggling to gain upward momentum as the U.S. Dollar stages a mild recovery. A brief rally in gold has lost steam, while traders remain cautious ahead of key labour market data. Expectations for Federal Reserve rate cuts still linger, but recent economic signals are mixed. Manufacturing remains weak, job openings have surprised, and upcoming payroll reports could shift market sentiment. Meanwhile, technical patterns point to underlying strength, yet a breakout remains elusive.
Gold faces resistance as Dollar strengthens and Fed signals loom
The gold price is struggling to attract fresh buying interest. A two-day recovery faded as the Dollar staged a mild comeback. This bounce followed a three-and-a-half-year low in the USD index on Tuesday. Meanwhile, expectations for Federal Reserve interest rate cuts continue to hover in the background. Traders remain cautious ahead of key labour market data due later this week. Any surprise in job numbers could shift the market’s outlook on interest rates and influence gold's direction.
Recent comments from Fed officials, including Michelle Bowman and Christopher Waller, indicate that the Fed may start cutting rates as early as July. Fed Chair Jerome Powell added to the dovish tone, noting the economic uncertainty created by U.S. trade policies. Traders now see a 20% chance of a July rate cut and a 75% probability of a cut in September.
On the data front, U.S. manufacturing activity continues to contract, although the pace of decline has slowed. The JOLTS report showed more job openings than expected, offering mixed signals for the labour market. Eyes are now on Wednesday's ADP jobs data and Friday's Nonfarm Payrolls (NFP), both of which could drive gold and the Dollar sharply.
Bullish patterns and triangle formation highlight key support for gold
The gold chart below shows a long-term ascending triangle pattern. This structure is defined by a rising support line and a horizontal resistance near the $3,440 level. Gold has repeatedly bounced off the rising trendline, showing strong buyer interest at higher lows.
Notably, two bullish hammer candlestick patterns have emerged near the trendline support. These formations are typically seen as signs of a potential price reversal or continuation of an uptrend. The first hammer appeared in early June, followed by another one just recently. Each time, gold has rebounded after touching the lower trendline.
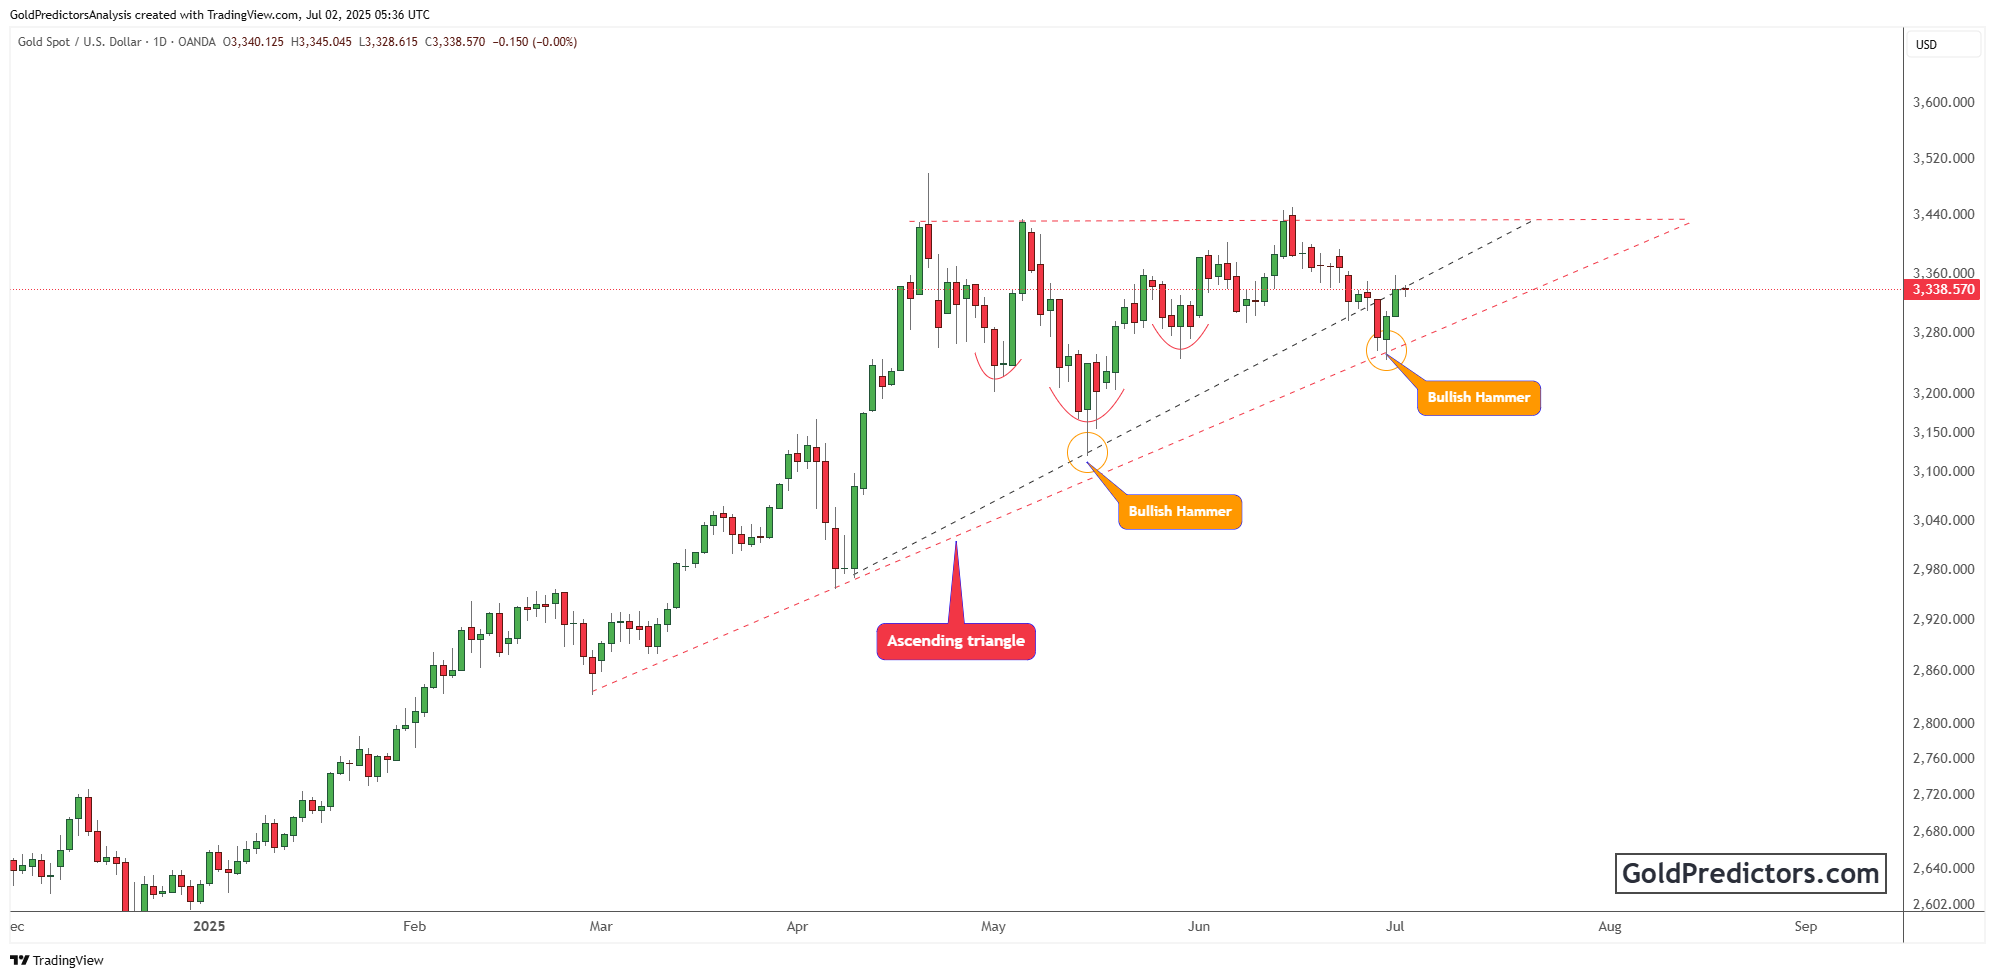
The price remains trapped within the triangle, and a breakout is yet to occur. The resistance around $3,440 remains firm. A decisive close above this level could trigger a strong bullish rally. On the downside, a break below the trendline could signal deeper losses. However, repeated bullish reactions near the support indicate buyers are still in control, for now.
Conclusion
Gold prices are stuck in a tight range as traders weigh mixed economic signals and wait for clarity on Fed policy. At the same time, a recovering Dollar pressures gold, expectations for rate cuts and fiscal concerns limit the downside. Technically, bullish candlesticks and an ascending triangle pattern suggest underlying strength. However, a breakout above resistance or a breakdown from support will likely depend on the outcome of key U.S. job reports this week.
Unlock exclusive gold and silver trading signals and updates that most investors don’t see. Join our free newsletter now!
Unlock exclusive gold and silver trading signals and updates that most investors don’t see. Join our free newsletter now!
Author

Muhammad Umair, PhD
Gold Predictors
Muhammad Umair is a financial markets analyst and investor who focuses on the forex and precious metals markets.


