The gold/silver ratio has rolled over once more. Whilst we can see it headed for the mid-70’s, a few technical indications point towards a pause first.

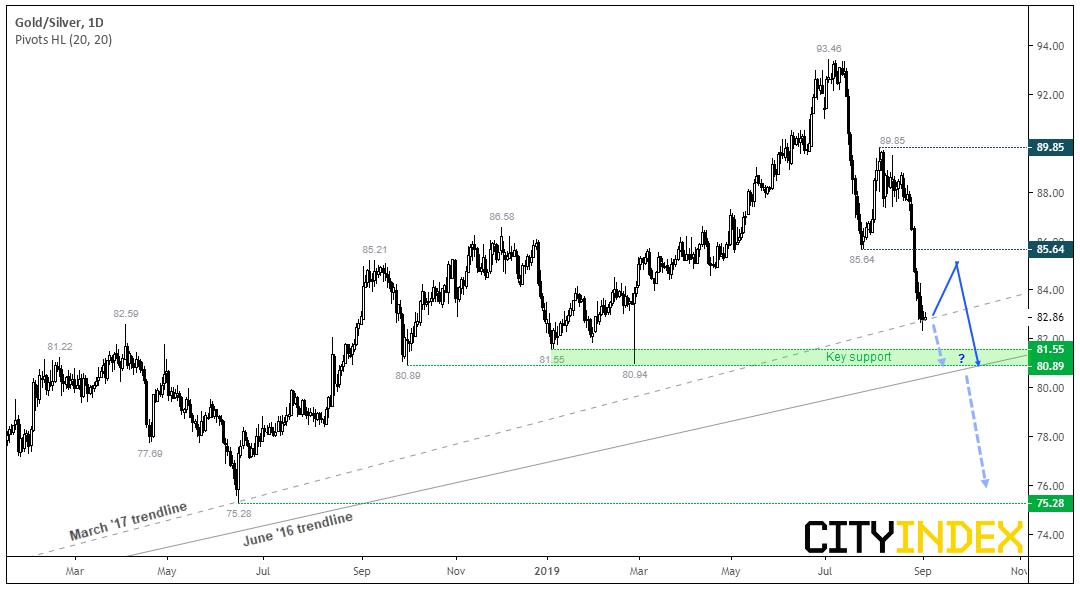
In percentage terms, we had suggested it could reach the mid 70’s if we’re to see a similar retracement to the one seen in 2016, and momentum during this decline suggests it’s giving it a good go. The leg down from 89.85 is of similar velocity and depth the fall from 93.46, and both have been relatively straight lines to denote how silver has clearly had the edge. However, given technical levels on the ratio and silver, we suspect the ratio’s decline is due a pause before its next decline.

XAU/XAG has stalled at a bullish trendline generated from the March 2017 low, although it could be argued the more reliable trendline is the one generated from the July 2016 (at the end of its last, deep correction). Even so, volatility is beginning to subside which leaves the potential for the ratio to consolidate or (better still) retrace.

If the ratio falls further, there’s a decent zone of support around the 80.89-81.55 lows, which also coincides with the July 2016 trendline, and it’s possible we may see a more credible reaction there. However, a break beneath 80.89 suggests prices are on track to drop to the mid-70’s (and possibly further if the long-term chart is anything to go by).

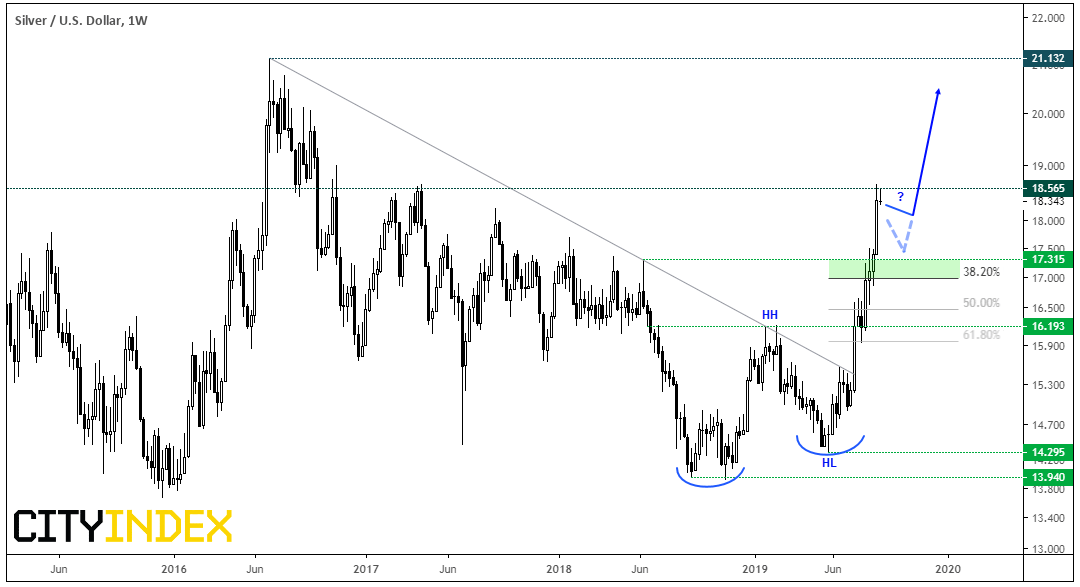
Finishing up on silver, it’s reached out initial target and stalled around the 18.56 highs, after breaking out of a basing pattern. Whilst the reward to risk potential appears undesirable on the daily chart, around current levels, it does also points to an increased likelihood gold may outperform silver over the near-tern, to allow the ratio to retrace. From here we’re looking for any consolidation (at a minimum) but also for prices to retrace, build a new higher and form a base, before getting overly bullish again.

Related analysis:
The Gold/Silver Ratio Could Pay Handsomely In Silver
Gold correction likely

CFD and forex trading are leveraged products and can result in losses that exceed your deposits. They may not be suitable for everyone. Ensure you fully understand the risks. From time to time, City Index Limited’s (“we”, “our”) website may contain links to other sites and/or resources provided by third parties. These links and/or resources are provided for your information only and we have no control over the contents of those materials, and in no way endorse their content. Any analysis, opinion, commentary or research-based material on our website is for information and educational purposes only and is not, in any circumstances, intended to be an offer, recommendation or solicitation to buy or sell. You should always seek independent advice as to your suitability to speculate in any related markets and your ability to assume the associated risks, if you are at all unsure. No representation or warranty is made, express or implied, that the materials on our website are complete or accurate. We are not under any obligation to update any such material. As such, we (and/or our associated companies) will not be responsible or liable for any loss or damage incurred by you or any third party arising out of, or in connection with, any use of the information on our website (other than with regards to any duty or liability that we are unable to limit or exclude by law or under the applicable regulatory system) and any such liability is hereby expressly disclaimed

Recommended Content


Recommended Content

Editors’ Picks

AUD/USD remained bid above 0.6500

AUD/USD remained bid above 0.6500

AUD/USD extended further its bullish performance, advancing for the fourth session in a row on Thursday, although a sustainable breakout of the key 200-day SMA at 0.6526 still remain elusive.

AUD/USD News

EUR/USD faces a minor resistance near at 1.0750

EUR/USD faces a minor resistance near at 1.0750

EUR/USD quickly left behind Wednesday’s small downtick and resumed its uptrend north of 1.0700 the figure, always on the back of the persistent sell-off in the US Dollar ahead of key PCE data on Friday.

EUR/USD News

Gold holds around $2,330 after dismal US data

Gold holds around $2,330 after dismal US data

Gold fell below $2,320 in the early American session as US yields shot higher after the data showed a significant increase in the US GDP price deflator in Q1. With safe-haven flows dominating the markets, however, XAU/USD reversed its direction and rose above $2,340.

Gold News

Bitcoin price continues to get rejected from $65K resistance as SEC delays decision on spot BTC ETF options

Bitcoin price continues to get rejected from $65K resistance as SEC delays decision on spot BTC ETF options

Bitcoin (BTC) price has markets in disarray, provoking a broader market crash as it slumped to the $62,000 range on Thursday. Meanwhile, reverberations from spot BTC exchange-traded funds (ETFs) continue to influence the market.

Read more

US economy: slower growth with stronger inflation

US economy: slower growth with stronger inflation

The dollar strengthened, and stocks fell after statistical data from the US. The focus was on the preliminary estimate of GDP for the first quarter. Annualised quarterly growth came in at just 1.6%, down from the 2.5% and 3.4% previously forecast.

Read more

Majors

Cryptocurrencies

Signatures