Gold shaking hands with all-time highs

Safe-haven assets caught a strong bid in recent trading, directing Spot Gold to all-time highs of US$3,220/troy ounce versus the US dollar (XAU/USD). The shift towards safe-haven markets was fuelled by softer demand for the USD as markets fled dollar assets, as well as escalating trade tensions between the US and China. Unsurprisingly, the Swiss franc (CHF) and Japanese yen (JPY) also attracted substantial bids, with the USD/CHF pair notching up losses of nearly 4.0% – its largest one-day drop since 2015!
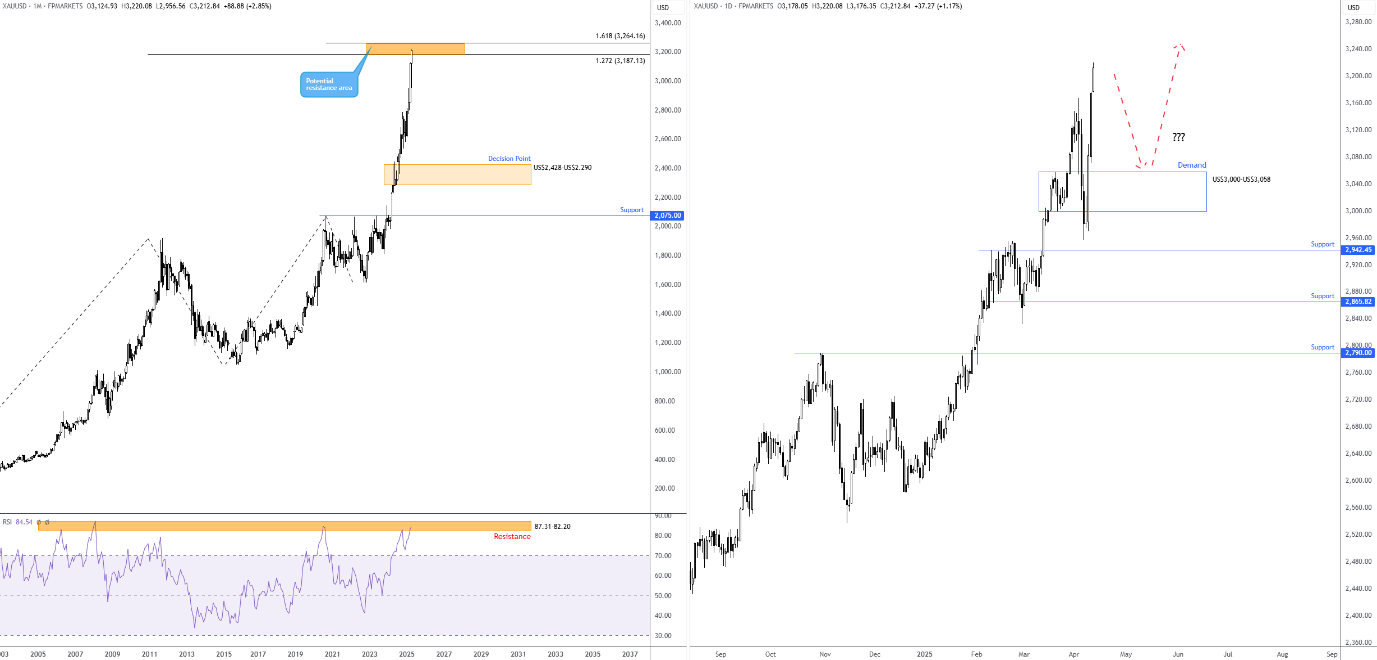
Monthly resistance and oversold conditions
Several desks are reportedly eyeing US$3,500 as the next upside objective for Gold; however, the monthly chart reveals it is considerably overbought according to the Relative Strength Index (RSI). You will note the RSI has remained within overbought territory since mid-2024 and recently touched gloves with familiar resistance between 87.31 and 82.20. This area boasts historical significance from as far back as 2006, and each time the Index has approached the resistance, a correction/pause typically followed in the yellow metal. Consequently, it raises the question about whether buying is set to moderate/pause at the monthly resistance area between US$3,264 and US$3,187 (made up of 1.618% and 1.272% Fibonacci projection ratios, respectively)?
Daily demand zone, dip-buying?
Meanwhile, on the daily chart, price action came within a stone’s throw of testing support from US$2,942 at the beginning of the week before rallying to all-time highs noted above. What is interesting from a technical perspective is that the move left behind a demand area at US$3,000-US$3,058, which, in my opinion, represents a key technical zone.
With Gold firmly entrenched in a strong uptrend, dip-buyers could emerge from the daily demand area if a correction occurs. That said, given technical indicators on the monthly chart suggesting buyers could pump the brakes, any dip-buying activity would likely be approached with caution. Confirmation – such as a bullish candlestick signal or supporting price action on lower time frames – might be required before pulling the trigger. However, any movement below the mentioned demand area signals bearish strength from the monthly resistance zone, and potentially opens the door to short-term selling opportunities, targeting daily support at US$2,942, closely followed by support at US$2,865, and possibly US$2,790.
Charts created using TradingView
Author

Aaron Hill
FP Markets
After completing his Bachelor’s degree in English and Creative Writing in the UK, and subsequently spending a handful of years teaching English as a foreign language teacher around Asia, Aaron was introduced to financial trading,


