Based on history we may still be in the early stages of a long-term inflationary cycle
History doesn’t necessarily repeat, but it often rhymes, and if the inflationary era of the 1960s and 70s is any indication, we are only in the early stages of a secular inflationary cycle.
Price inflation spiked in the wake of the COVID-era stimulus at 9.1 percent in June 2022. After insisting the surge was “transitory” for months, the Fed finally acted, raising interest rates from zero in March 2022 and ultimately pushing them to between 5.25 and 5.5 percent in July 2023.
Tighter monetary policy, along with relatively aggressive Fed balance sheet contraction, helped drive price inflation down. However, the central bank never got back to the 2 percent target.
Now we’re seeing price inflation heat up again. The annual CPI rose to 3.8 percent in April, the highest level since May 2023.
Most analysts blame rising price inflation on the U.S.-Iran war. The ensuing oil shock has undoubtedly juiced price inflation, but it’s not solely to blame. The economy has been on an inflationary trajectory for more than a year, with the money supply increasing from $21.61 trillion in February 2025 to $22.67 trillion in February 2026, a 4.9 percent increase.
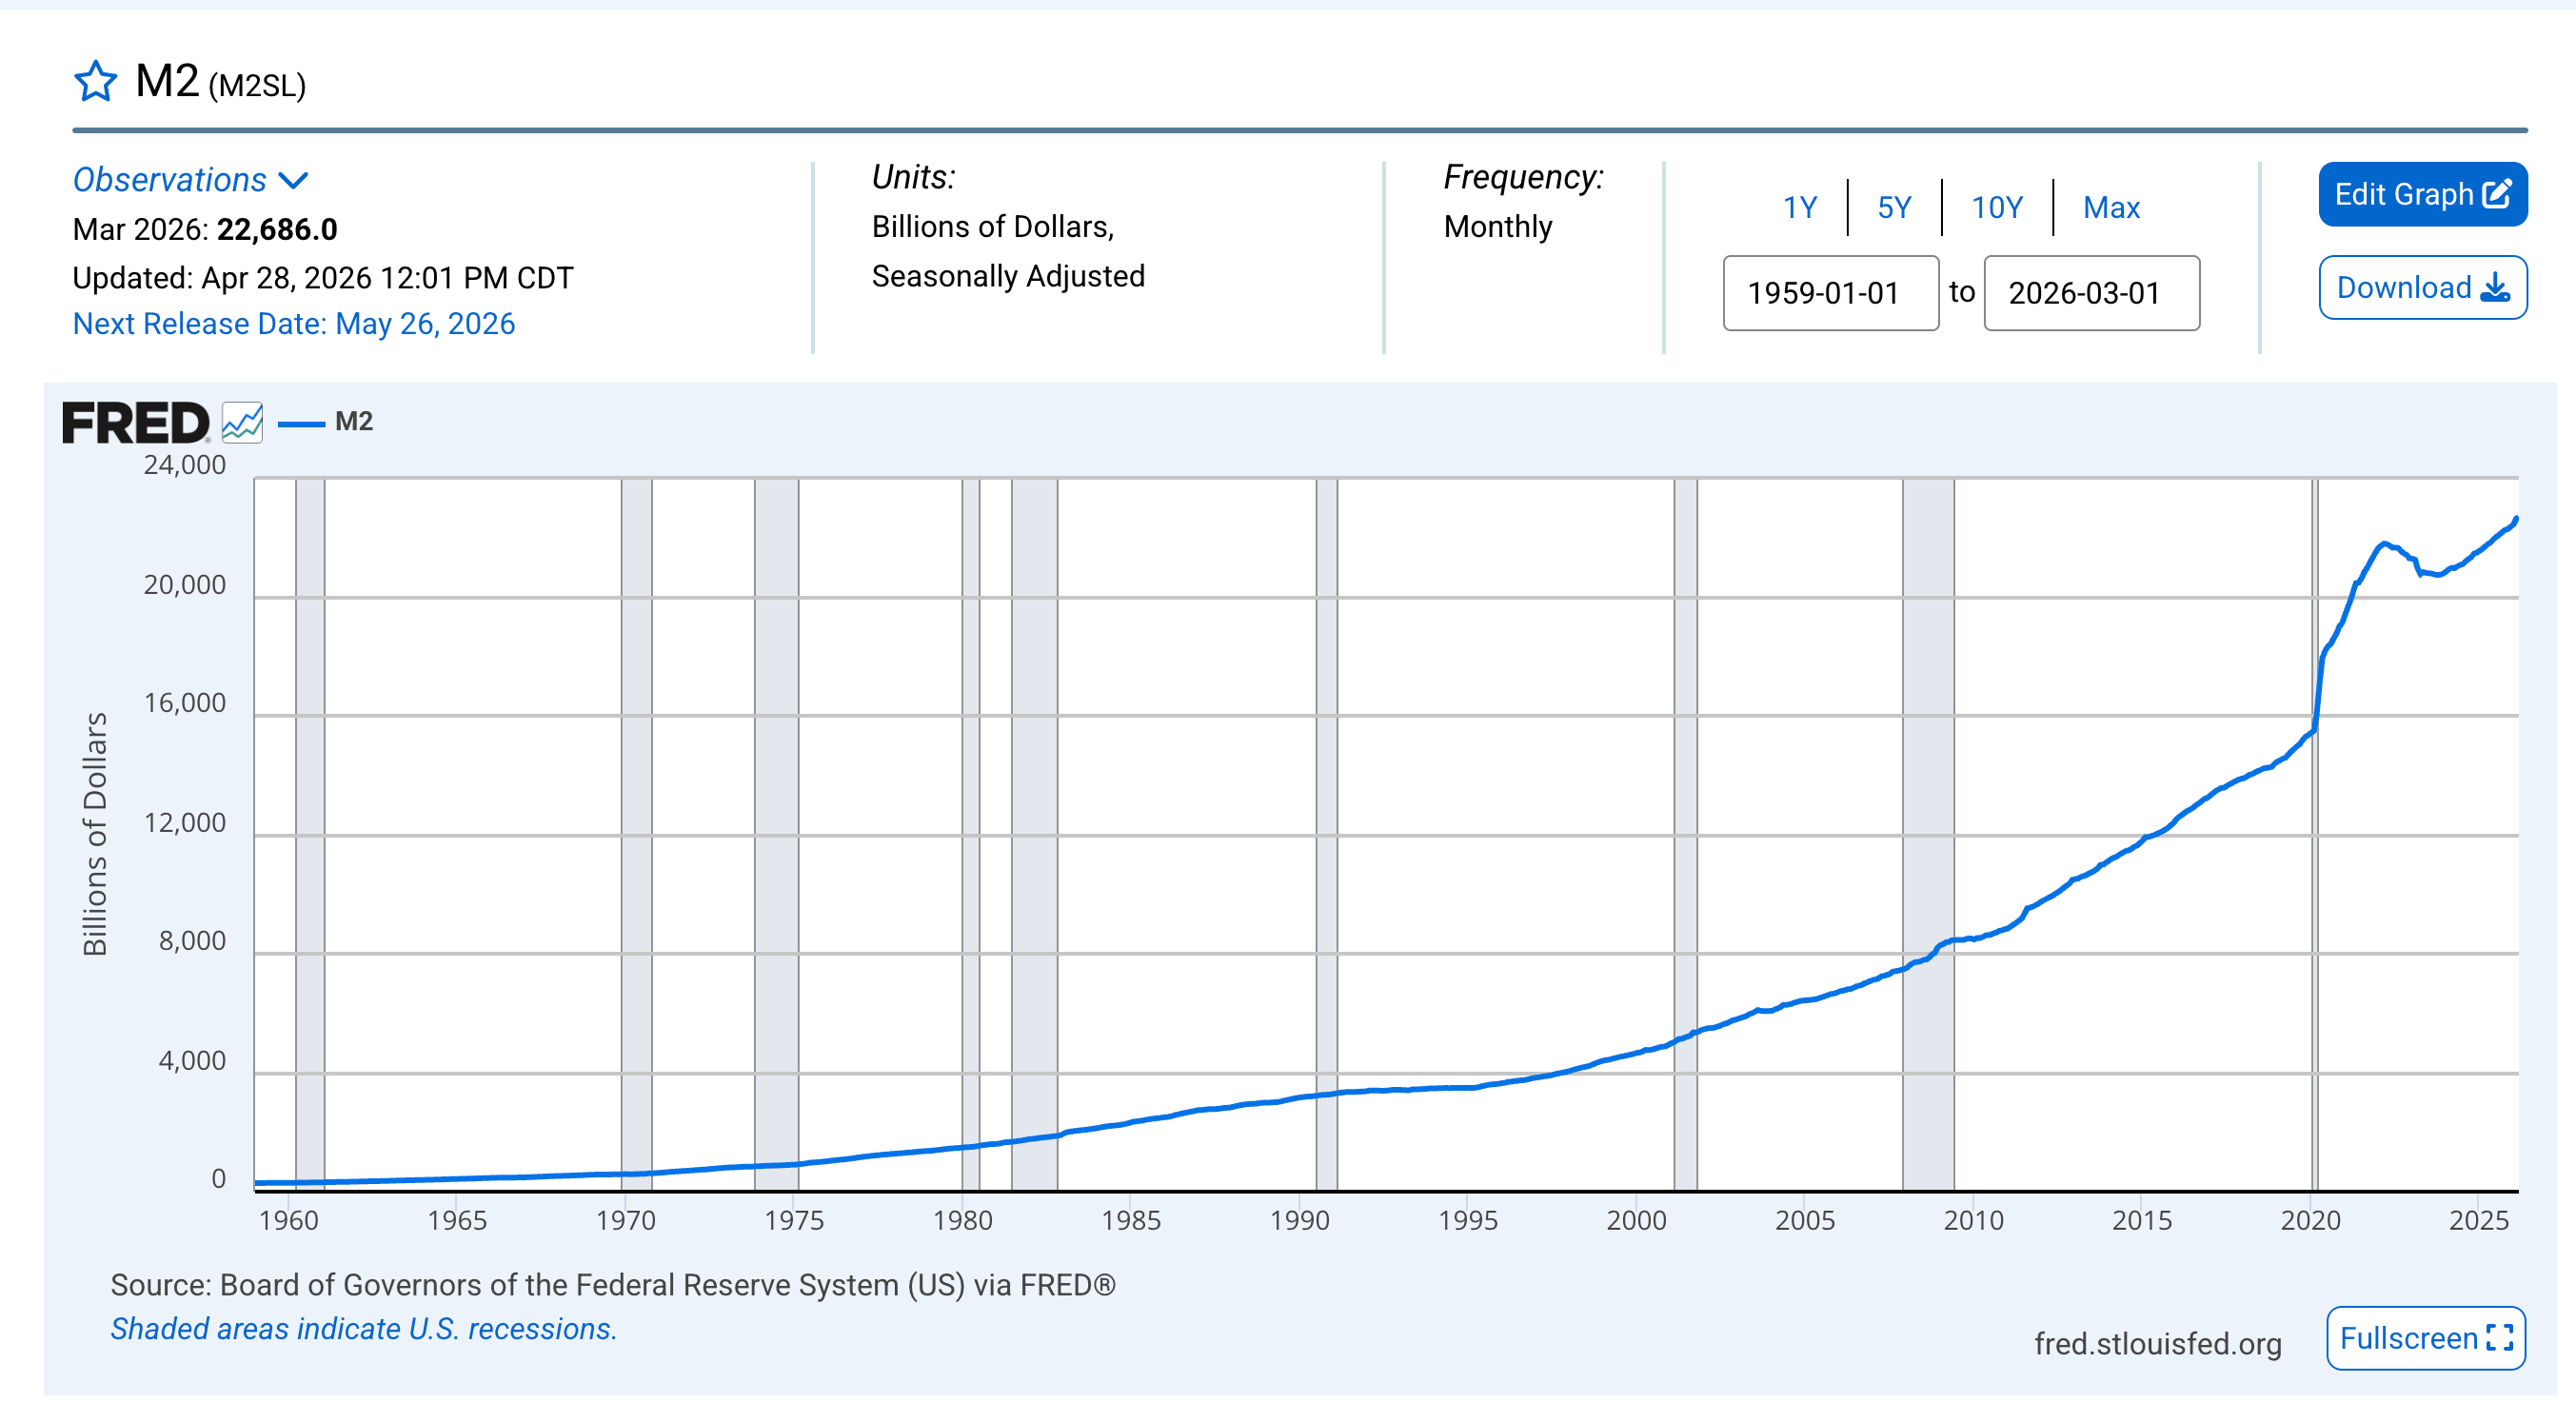
This is, by definition, inflation.
Keep in mind that the CPI doesn’t measure inflation as economists have historically defined it. From an economic standpoint, inflation is an increase in the supply of money and credit. Rising consumer prices measured by CPI are one symptom of this monetary inflation. Even without the war, this rising inflation would have eventually found its way into consumer prices.
The Inflationary 60s and 70s
Whether it’s due to the war, the increasing money supply, or some combination of the two, price inflation is clearly setting up for a second wave.
And this is exactly what happened in the 1960s and 1970s.
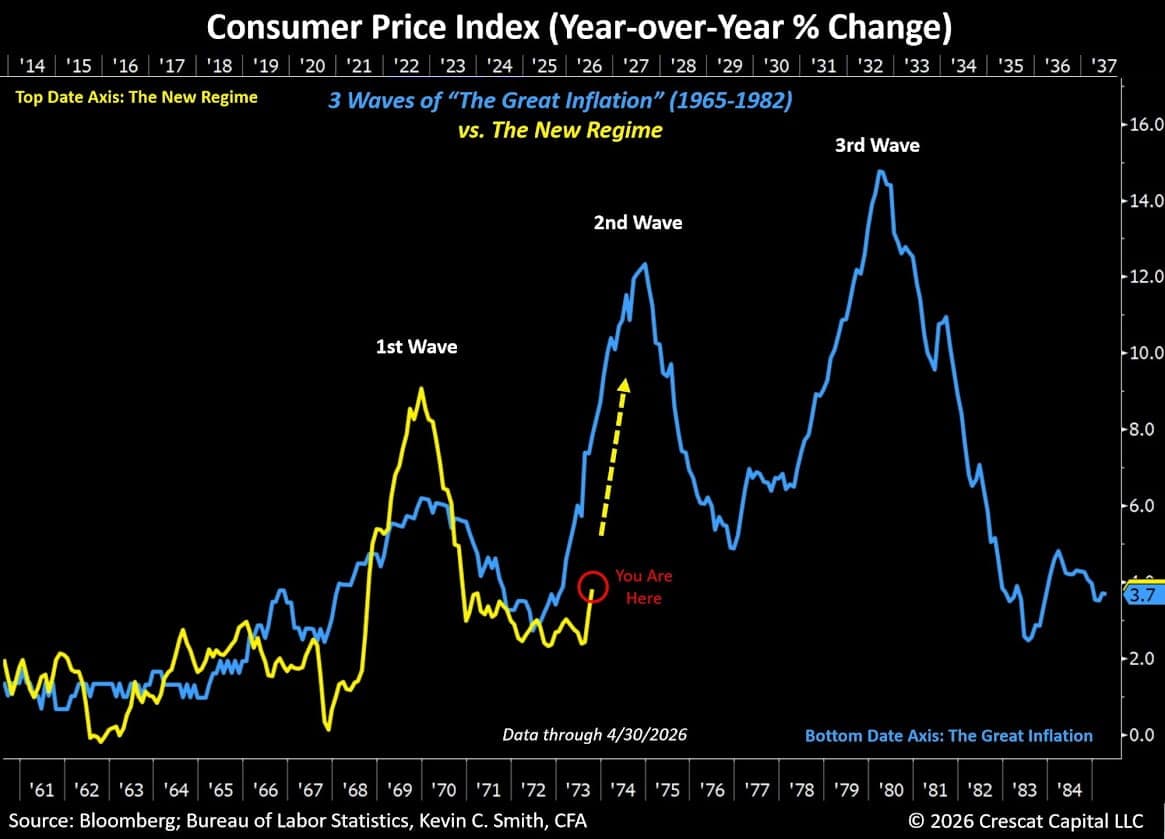
As you can see by the chart, the price inflation didn’t rise in a straight line during that era. It came in three waves. If history is any indication, we may well still be early in this inflationary surge.
You’ll note that the first wave of inflation eased in the early 1970s. The Fed hiked rates in 1969, with the effective federal funds rate peaking at 8 percent in 1969. This brought price inflation back under control, and the Fed cut rates in 1970. That set the stage for the second wave of inflation that peaked in 1974.
Once again, the central bank responded by jacking up rates, with a 10.5 percent peak in 1974. And once again, the inflationary pressure eased.
So, what did the central bank do?
It eased rates again, setting the stage for the third wave of price inflation.
Price inflation wasn’t put in the grave for good until Paul Volcker cranked rates to 20 percent.
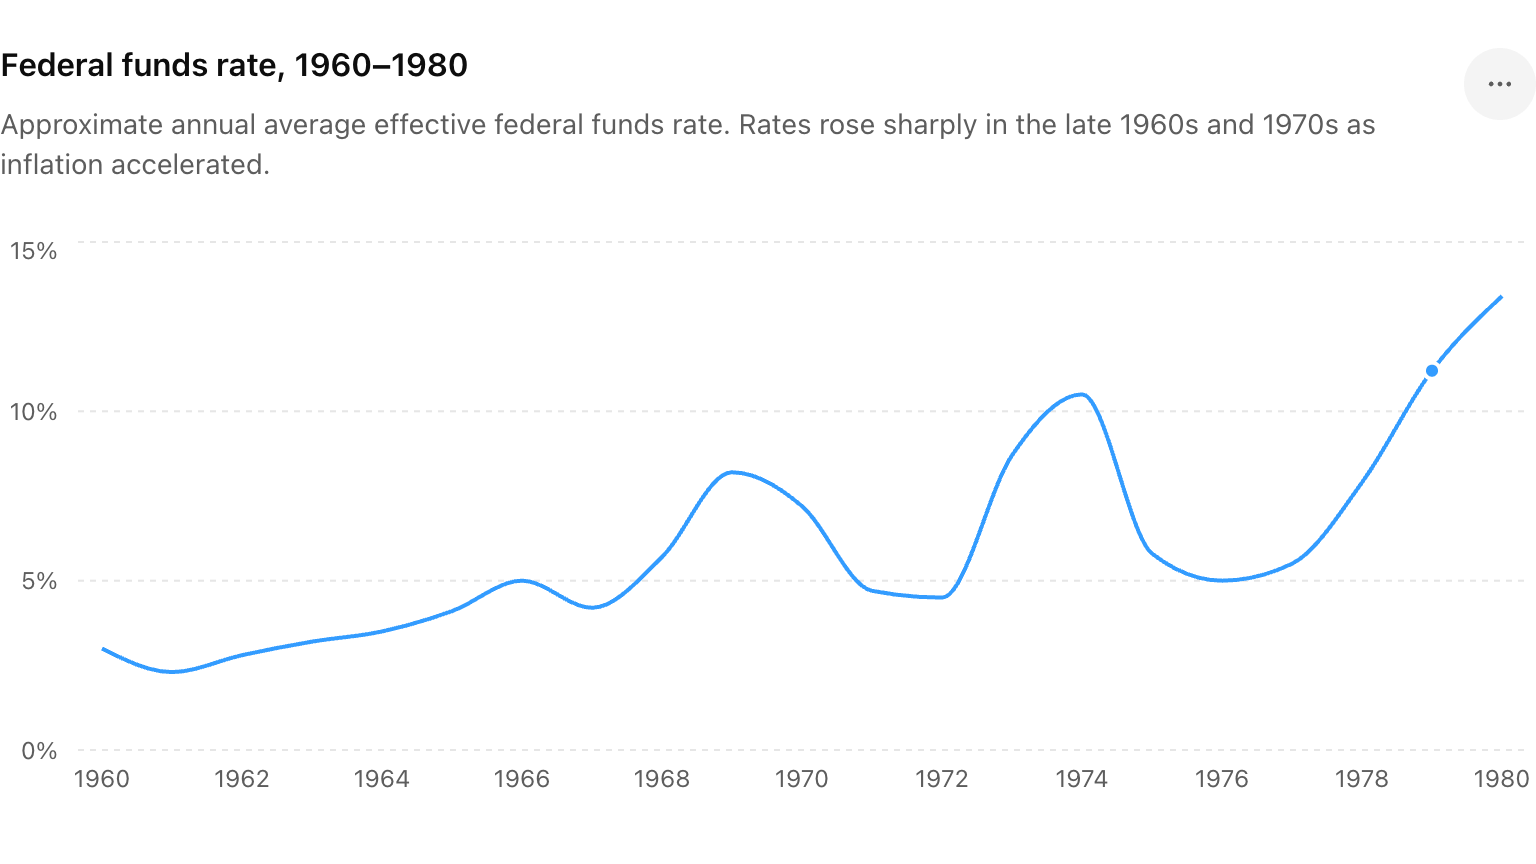
If you see a worrisome trend here, you get the point.
The government spending machine
Price inflation is ultimately driven by money creation. But why do governments print money?
They need to borrow and spend.
Government outlays increased steadily in the 60s and 70s thanks to Lyndon B. Johnson’s Great Society social spending, coupled with the Vietnam War. The necessitated borrowing.
Fast forward to the most recent inflation spike. It followed massive levels of spending and stimulus during the pandemic. To support the borrowing and spending, the Federal Reserve slashed rates to zero (after barely pushing them up in the wake of the Great Recession) and ran nearly $5 trillion in quantitative easing (QE). The Fed monetized nearly all the debt accumulated during the COVID years. In other words, it bought government bonds with money created out of thin air and held those bonds on its balance sheet. This created artificial demand for U.S. debt and allowed the government to borrow more at lower rates.
This chart shows a clear correlation between government spending (as a percentage of GDP) and price inflation (as measured by the CPI). That’s because borrowing, spending, and money creation are linked at the hip. Fed money printing supports government borrowing and spending.
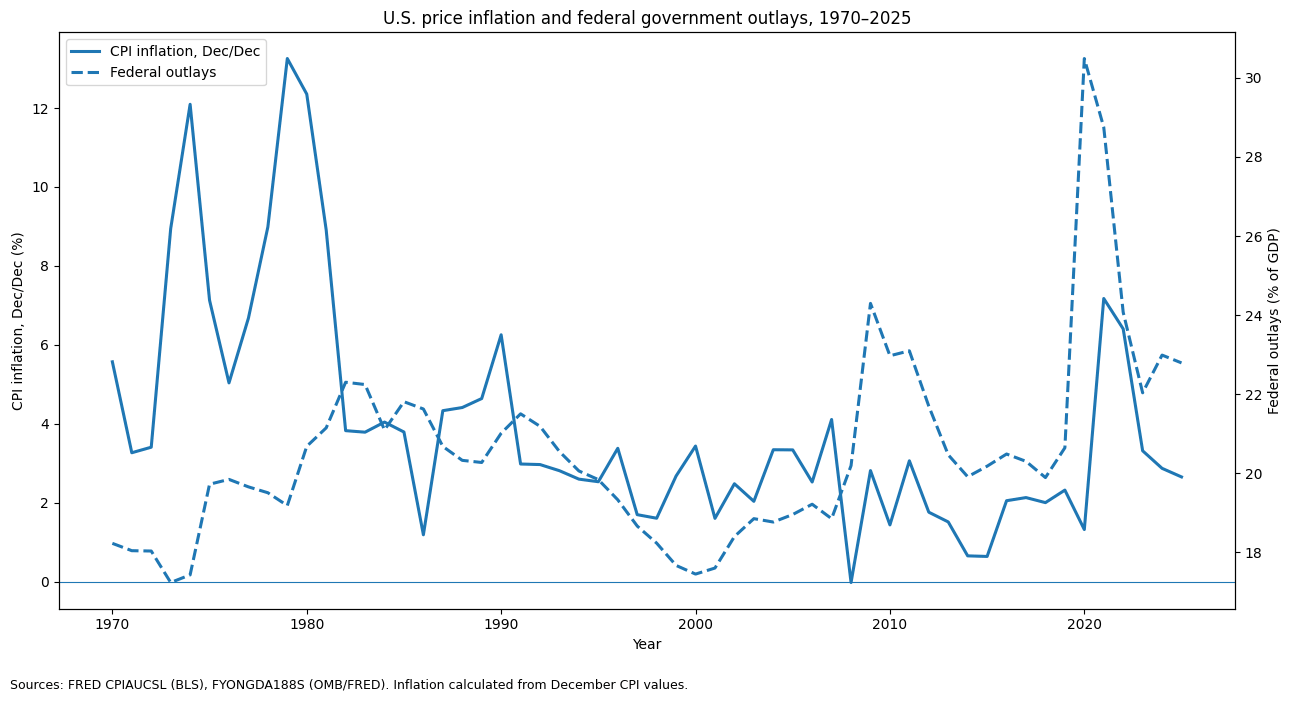
Economist Mark Thornton argued that this is the very reason the Federal Reserve exists.
“The idea of the Fed is to help finance government largesse – to finance government spending and government deficits. That’s really what their true role is. It’s not balancing inflation and unemployment.”
Think about the ramifications today as the U.S. government continues to run massive budget deficits month after month.
And now we have a war.
The Iran conflict may well be the catalyst for the next inflation wave. (Not so much because oil is more expensive, but because the government will have to borrow and spend more – and the Fed will need to enable it.)
Again, history doesn’t always repeat. But this looks an awful lot like a sequel to the 60s and 70s.
Unfortunately, sequels are rarely better than the original.
To receive free commentary and analysis on the gold and silver markets, click here to be added to the Money Metals news service.
Author

Mike Maharrey
Money Metals Exchange
Mike Maharrey is a journalist and market analyst for MoneyMetals.com with over a decade of experience in precious metals. He holds a BS in accounting from the University of Kentucky and a BA in journalism from the University of South Florida.