Gold Set to Rally
Chaos Clinic for 10/2/2020
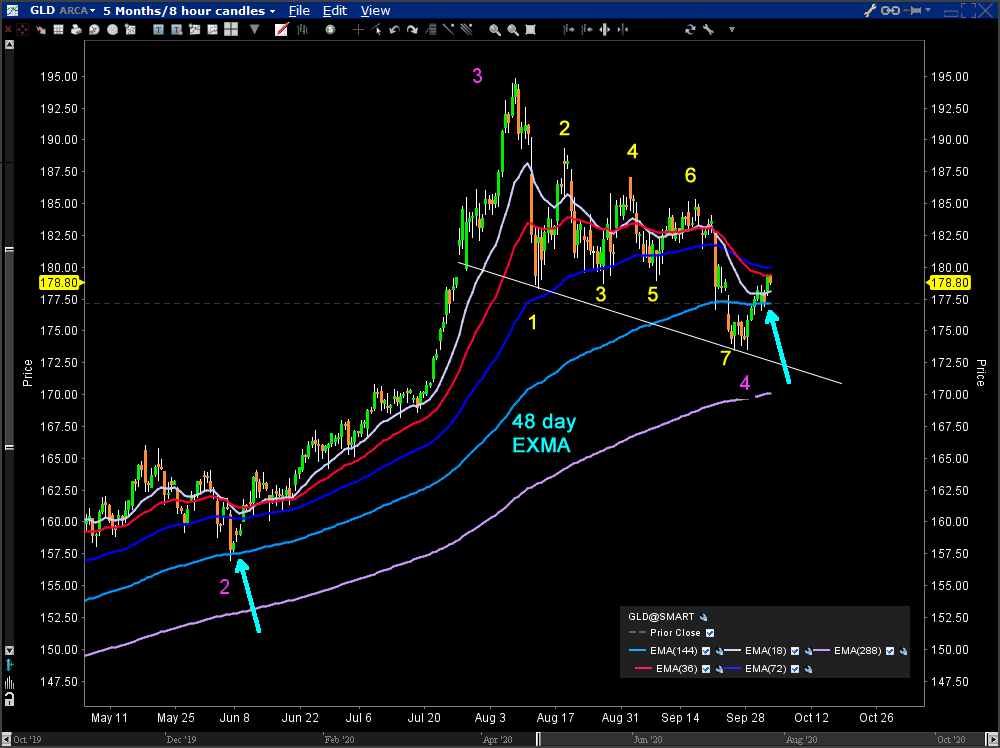
This is a 5 month 8 hour bar chart of the gold exchange traded fund GLD. For over two years, gold has been going up, as money flows out of riskier markets.
During June and and July, GLD soared. Then it started a pullback. That pullback now looks to be over.
Gold is in a larger Chaos Clamshell of which moves 2, 3, and 4 are shown by magenta numbers. Within move 4 down, there are 7 moves numbered in yellow.
Further evidence is provided by the 48 day EXMA. At the magenta 2 low prices bounced sharply off the EXMA. At the magenta 4 low, prices penetrated the EXMA,but rebounded above it. This is a sign of strength.
This content was published on Dr. Al Larson's Chaos Clinic which you can attend each Friday for free.
Dr. Al Larson has developed a complete Chaos Model of Markets, four unique courses that let you become a Certified Chaos Trader, some very unique eMylar fractal pattern overlays, and tools that permit forecasting individual stocks and markets years in advance. You can also sign up for a free weekly email, and attend a free Chaos Clinic on Fridays. To learn more, click on the author's profile.
Be sure to sign up for the free weekly email!
Author

Dr. Al Larson, PhD
MoneyTide.com
Dr. Al Larson holds a Ph.D. in Electrical and Computer Engineering from the University of Wisconsin. He is a 1964 Distinguished Graduate of the U. S. Air Force Academy.


