Gold sell down takes out reference low; SMA turns down

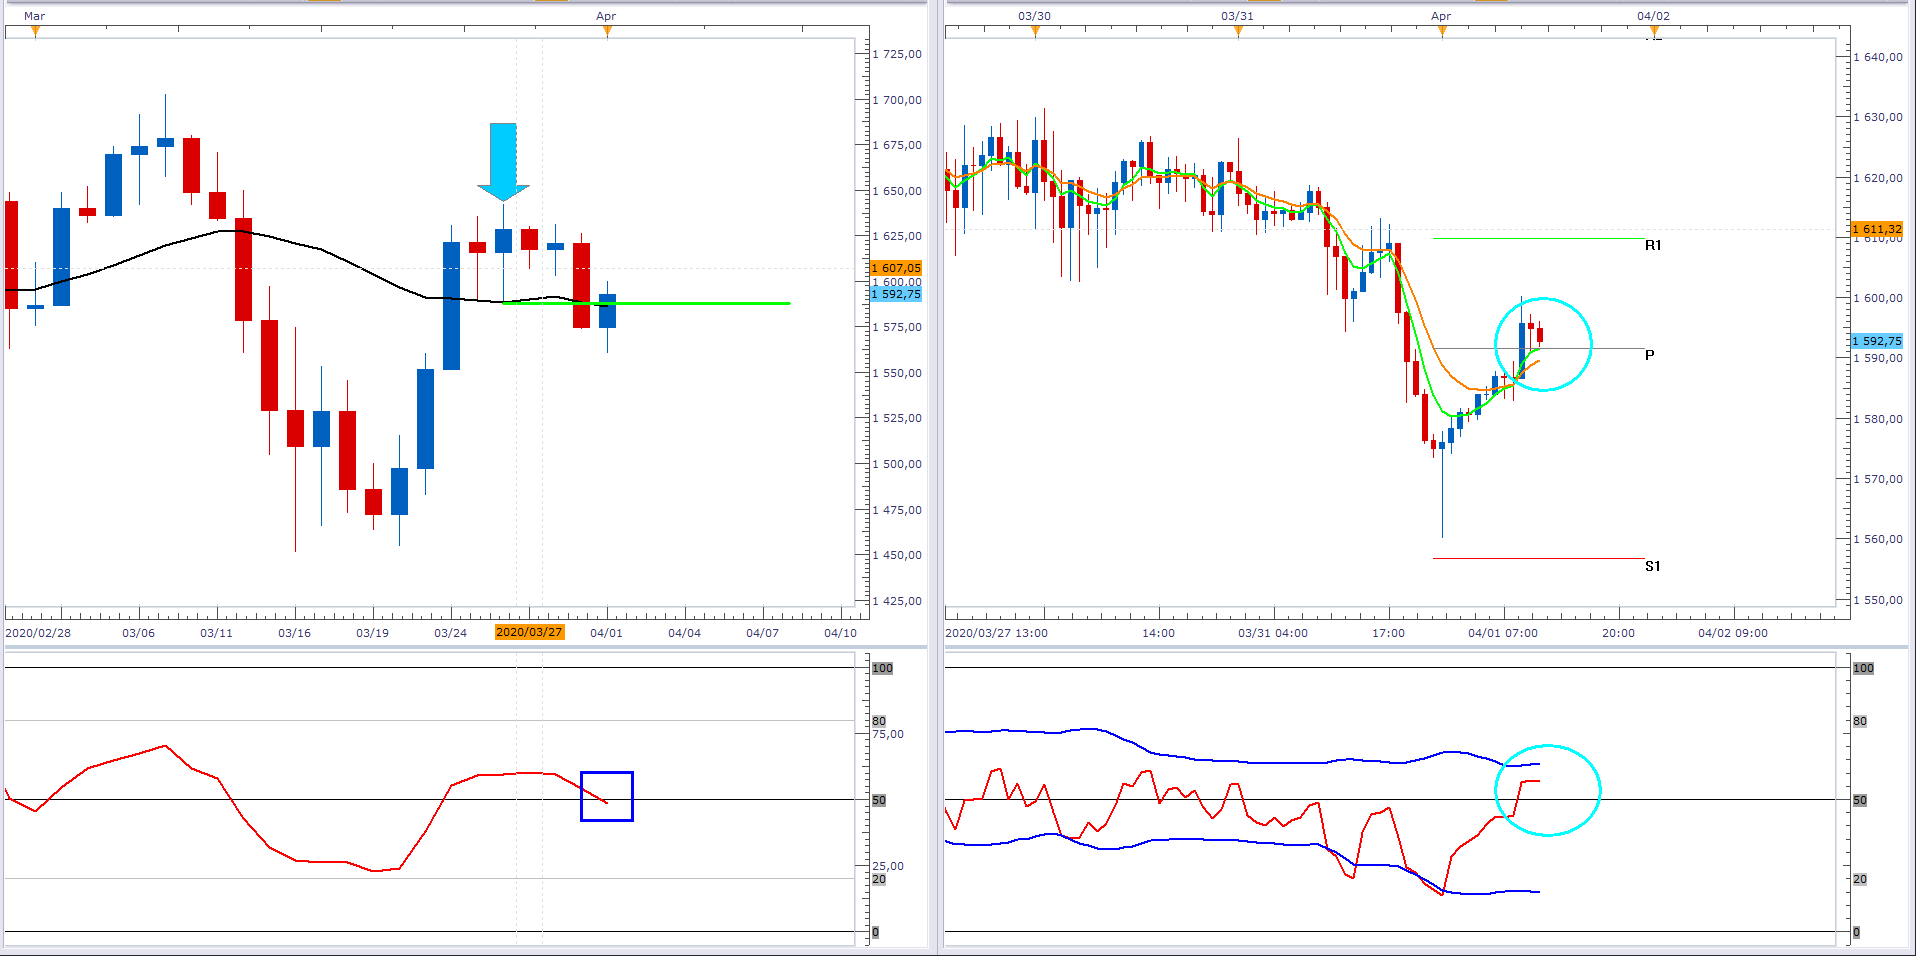
The left chart below shows the daily time frame of XAUUSD. Last Thursday’s candle shows a high just shy of 1,643. Using this as a reference candle (blue arrow), yesterday’s sell down in the precious metal has taken its low (green horizontal). The black 20-day SMA has turned down and the RSI is flirting with the 50 line, looking to dip below. These are bearish developments. The right chart shows the hourly time frame Price is testing the central pivot (P). If the green 5-hour EMA crosses below the orange 10-hour EMA and the hourly RSI drops below 50 (aqua ellipses), these may confirm that sellers are starting to gain control.
Past performance is not an indicator of future results
CHART SOURCE: FXCM MARKETSCOPE 2.0
Author

Russell Shor (MSTA, CFTe, MFTA) has an Honours Degree in Economics from the University of South Africa and holds the coveted Certified Financial Technician and Master of Financial Technical Analysis qualifications from the Interna


