Gold prices remain stable despite geopolitical tensions

Gold dipped to approximately $3,376 per ounce on Wednesday at 13:04 et but largely retained its recent gains, staying near a two-week high. Ongoing expectations of a more dovish monetary policy continue to boost the appeal of the non-interest-bearing metal.
In July, US data showed a decline in the ISM services index, missing forecasts and indicating sluggish growth, falling employment, and rising price pressures. Last week’s additional data pointed to softening in the labor market and consumer spending.
These signs of economic weakness in the world's largest economy have heightened expectations that the Federal Reserve will ease monetary policy at its September meeting, with markets now assigning a 93% chance of a rate cut.
Gold has also gained support from President Trump’s recent tariffs and renewed concerns over the Fed’s independence following Governor Kugler’s resignation, which may allow Trump to appoint a more dovish successor.
Technical analysis perspective:
Gold / US Dollar:
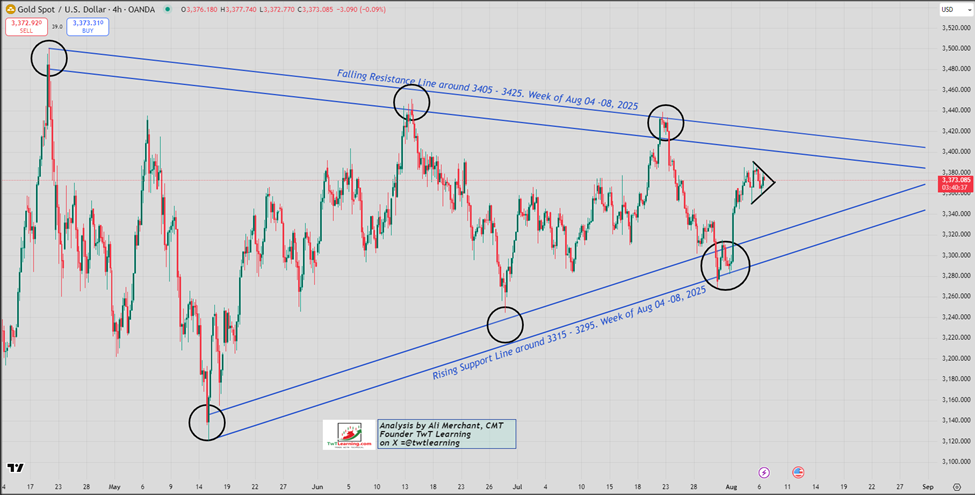
- Gold is currently trading within a large symmetrical triangle on the four-hour charts.
- The descending resistance line from the April 2025 all-time high of 3,500 is acting as a key barrier around 3,405 to 3,425.
- Gold rebounded after maintaining the rising trendline from the May 2025 lows of 3,120, now approaching the 3,315 to 3,295 level.
- A small bullish pennant pattern is forming, indicating a potential rally to 3,405–3,425 if it breaks above the 3,385 resistance level.
- A decisive break below 3,355 support would negate the bullish outlook, targeting a decline to 3,325–3,320.
Gold 4 Hourly chart:
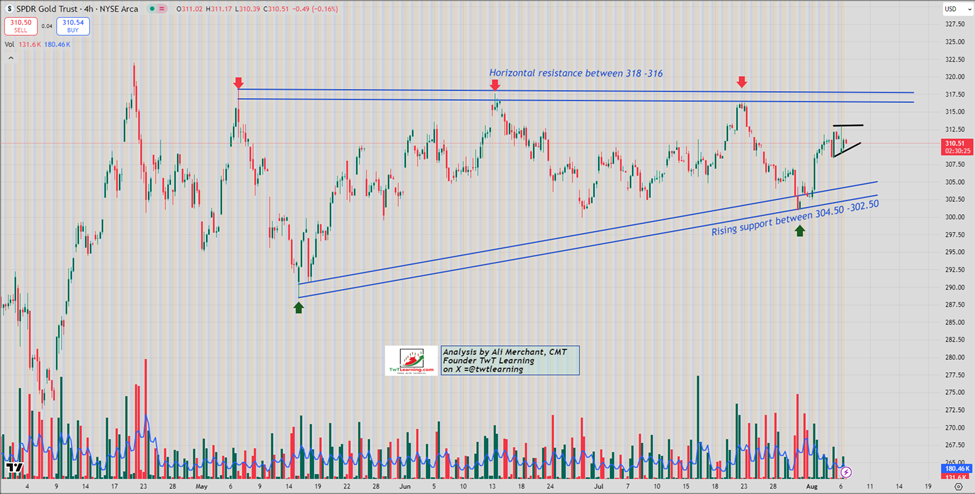
GLD (SPDR Gold Trust) ETF:
- GLD has respected the rising trendline support from the May 2025 low of 292.87, now trading between 304.50 and 302.50.
- The ETF needs to surpass the 313.50 barrier to trigger a further move upward toward the 316–318 resistance zone.
- Failing to hold the 308.50 support level could lead to a decline toward the 304.50–302.50 area.
GLD 4 Hourly chart:
GLD Seasonality:
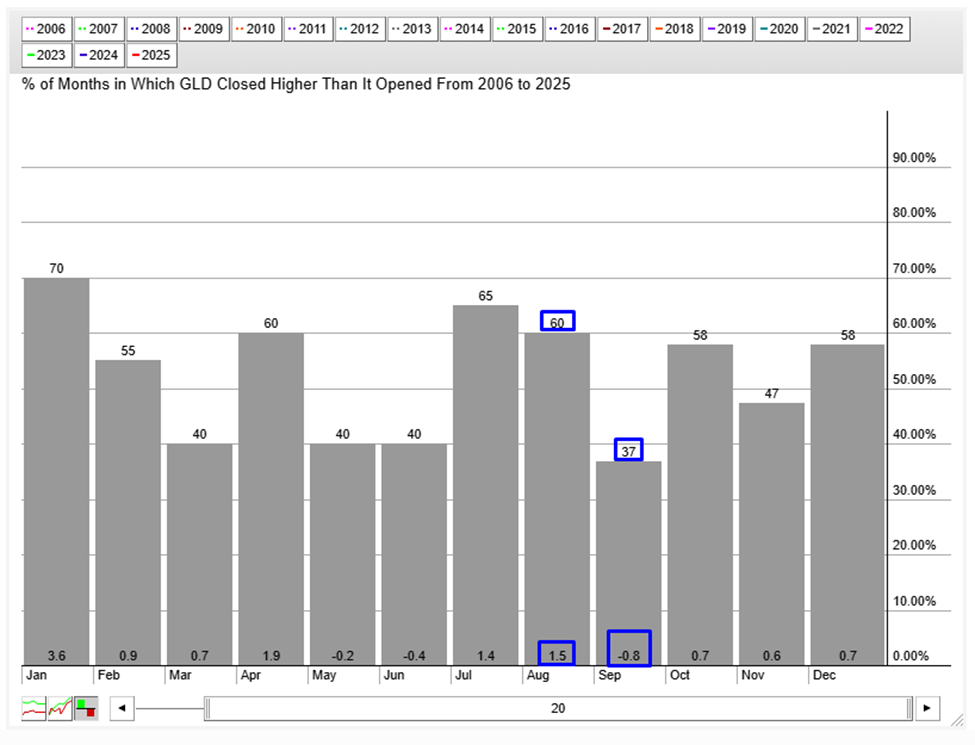
Since 2006, GLD has posted an August gain of 1.5% in 60% of the years, while September has seen a decline of 0.80% in 37% of the years.
Author

Ali Merchant, CMT
TwT Learning
Ali Merchant is a seasoned financial market professional with expertise in Technical Analysis, Treasury & Capital Markets, Trading, Sales, Research, Training, & Fund Management, He has been trading FX, FX options, US stock


