Gold price’s relentless rally

After a few years of having no trading positions in gold, I opened a long one.
Gold could reach $2,300
This might seem perplexing for those who read only free analyses from me and didn’t have the full picture – in the last few years I had long and short positions in mining stocks (featuring 12 profitably closed unleveraged positions in a row), but not in gold. The current situation is special, and it requires a special approach.
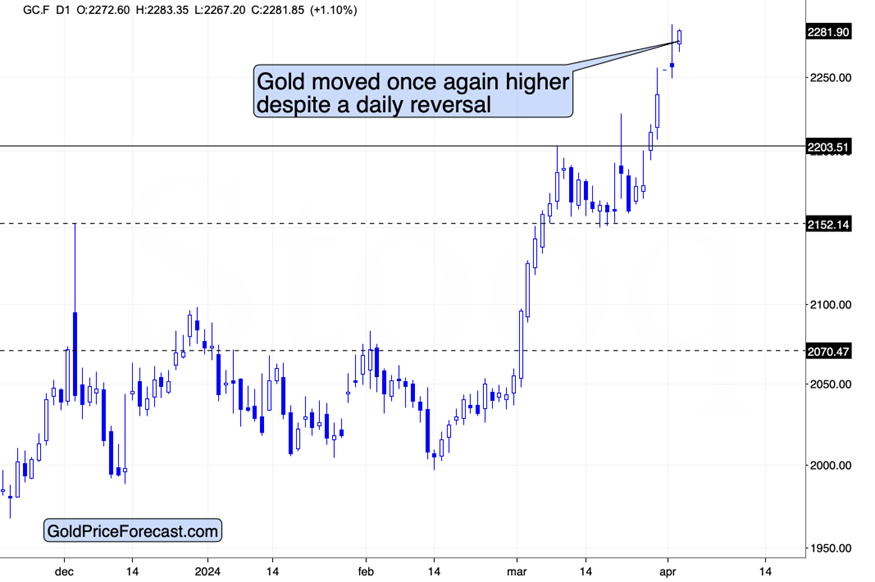
The most interesting thing about gold price from the short-term point of view is its resilience.
Whatever happens, gold shrugs it off. We just saw a daily reversal that formed when gold-based RSI was above 70, indicating already overbought situation. In normal circumstances, this would be a perfect sell sign.
The thing is – gold already showed that it can ignore the classic short-term sell signs during this upswing. This looks and feels like what we saw in 2011 – the mid-March price moves simply were not the double top of the rally. The sentiment is very much alike, though. And it can help to push gold to even higher levels. $2,300s can be seen as early as this week.
In my Friday’s flagship analysis, I wrote about multiple factors in other markets that could make gold decline, but one of them seems to be particularly important right now. It’s the situation in the USD/YEN exchange rate.
Gold moved in tune with the yen for many years, and if the yen was to slide now (so, the USD/YEN would move UP), gold would be VERY likely to react by declining as well. Forex and gold are not that connected at the moment, but it’s likely to change soon.
The situation in the USD/YEN exchange rate looks like this:
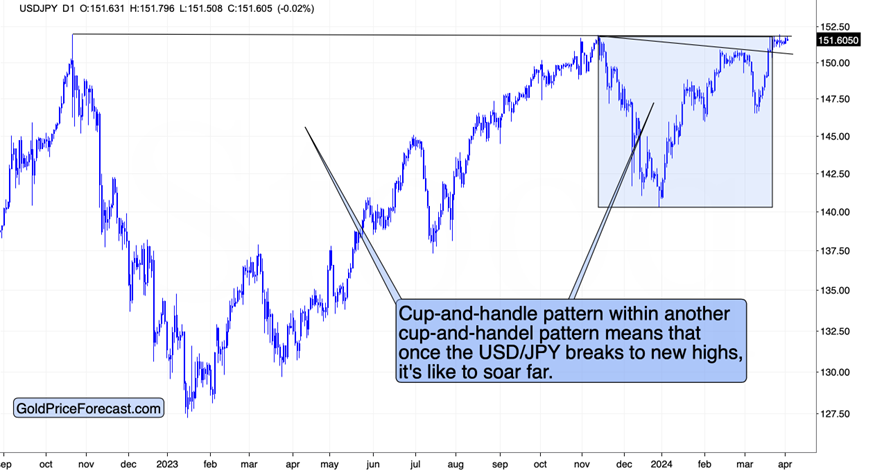
It’s after a confirmed breakout from a small cup-and-handle pattern and the current trading looks like the final days (hours?) of trading before the big cup-and-handle pattern is completed. The small pattern suggests that the bigger pattern will be completed. And both patterns suggest much higher USD/JPY values, which is very bearish for gold.
USDX breakout raises questions
The last several days were back-and-forth trading very close to the previous highs… And that’s what already makes the current case special. The 2022 top was sharp, and it was immediately followed by a decline. The late-2023 top wasn’t as sharp, and the price even tried to move higher twice. This time, the price stayed higher – there was no decline.
After the consolidation, the price can rally once again, and after the breakout, it can truly soar.
This would very likely mean the end of gold’s rally, at least in the short term.
This means that while gold might rally for another $100 here, it might as well top any day or hour now, if the USD/JPY breaks higher.
Again, the above is a “might” and the fact is that gold keeps rallying regardless of pretty much anything else. Consequently, the odds are that the upside target could be reached this month, perhaps within the next 2 weeks. And perhaps we might not even have to wait that long…
Yesterday, the USD/JPY moved higher, but it didn’t break above the previous highs. Gold declined initially, but then it rallied back up, confirming the no breakout = no end to the rally rule.
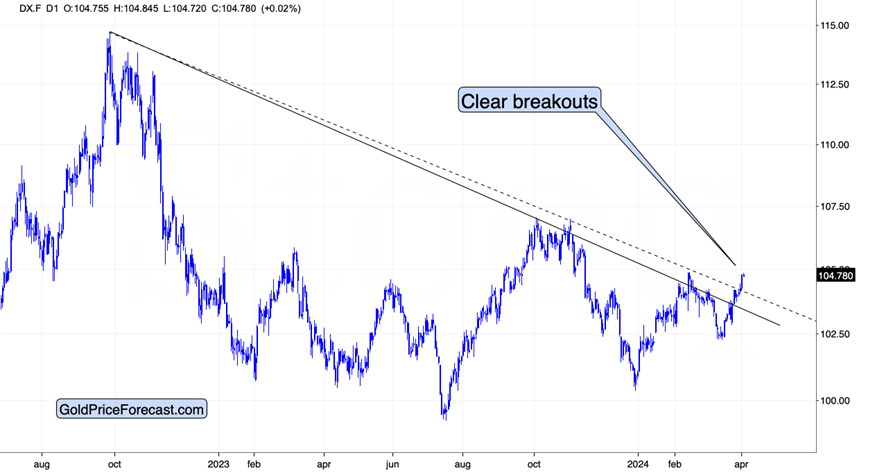
The USD Index broke above the declining resistance lines making it clear that the next big move in it will be to the upside. Why isn’t gold declining in this case? Because the increase in U.S. dollar’s value was primarily against the euro. Or one could say that it was not the dollar that got stronger, but rather it was the euro that weakened.
After all, currencies do not float, they sink at different rates. This time, the euro is sinking faster. Anyway, without the breakout in the USD/JPY (so without weakness in yen vs. the USD) it seems that gold’s rally can continue.
And given the current strong momentum in gold price, it seems that it could take just several days (perhaps less than two weeks that I mentioned previously) for gold to reach its upside target. So, it COULD be the case that the USD/JPY pair continues to trade sideways for several additional days and its breakout would coincide with gold’s top.
Want free follow-ups to the above article and details not available to 99%+ investors? Sign up to our free newsletter today!
Want free follow-ups to the above article and details not available to 99%+ investors? Sign up to our free newsletter today!
Author

Przemyslaw Radomski, CFA
Gold Price Forecast
Przemyslaw Radomski, CFA (PR) is a precious metals investor and analyst who takes advantage of the emotionality on the markets, and invites you to do the same. His company, Sunshine Profits, publishes analytical software that any


