Gold prices pause after a sharp rally as tariff and recession concerns grow
Gold prices have paused after a strong rally as investors take time to digest the latest global trade news. This comes as traders absorb new tariff developments announced by US President Donald Trump. The recent surge in prices has been driven by growing fears over a recession and rising geopolitical tensions, especially between the US and China. Now, with the upcoming holiday and growing global uncertainty, the market may see a short-term correction in gold prices.
Gold supported by safe-haven demand on tariff tensions and economic uncertainty
Gold prices surged this week to record highs as tensions rose between the US and China, but have since seen a slight decline. President Trump announced new tariffs, which raised fears of a trade war. Investors rushed to gold as a safe-haven asset. Rising uncertainty over US trade policy pushed buyers to seek protection from market risks.
Global tech stocks fell sharply, adding to market fears. ASML warned of uncertain demand due to tariffs. Nvidia also faced a major revenue hit from US restrictions on AI chip exports to China. These events showed how tariffs could hurt global growth. As a result, gold gained strong support from safe-haven demand.
Meanwhile, mixed signals from the US Federal Reserve kept traders cautious. Jerome Powell said the Fed will wait for more clarity before changing interest rates. He warned about stagflation risks linked to tariffs. At the same time, US-Japan trade talks gave some relief. But overall, market sentiment remains tense. This tension continues to support gold prices at higher levels.
Gold strong breakout suggests the new uptrend
The gold chart below shows that the price successfully bounced from the bottom of the channel. A clear inverse head and shoulders pattern also formed, which is another bullish sign. The neckline of this pattern acted as a resistance earlier but was later broken, confirming upward momentum.
The rally accelerated after this breakout. The price even broke through the upper boundary of the ascending channel, raising questions about a potential new breakout. A sharp rise followed, pushing gold to new highs around $3,322.
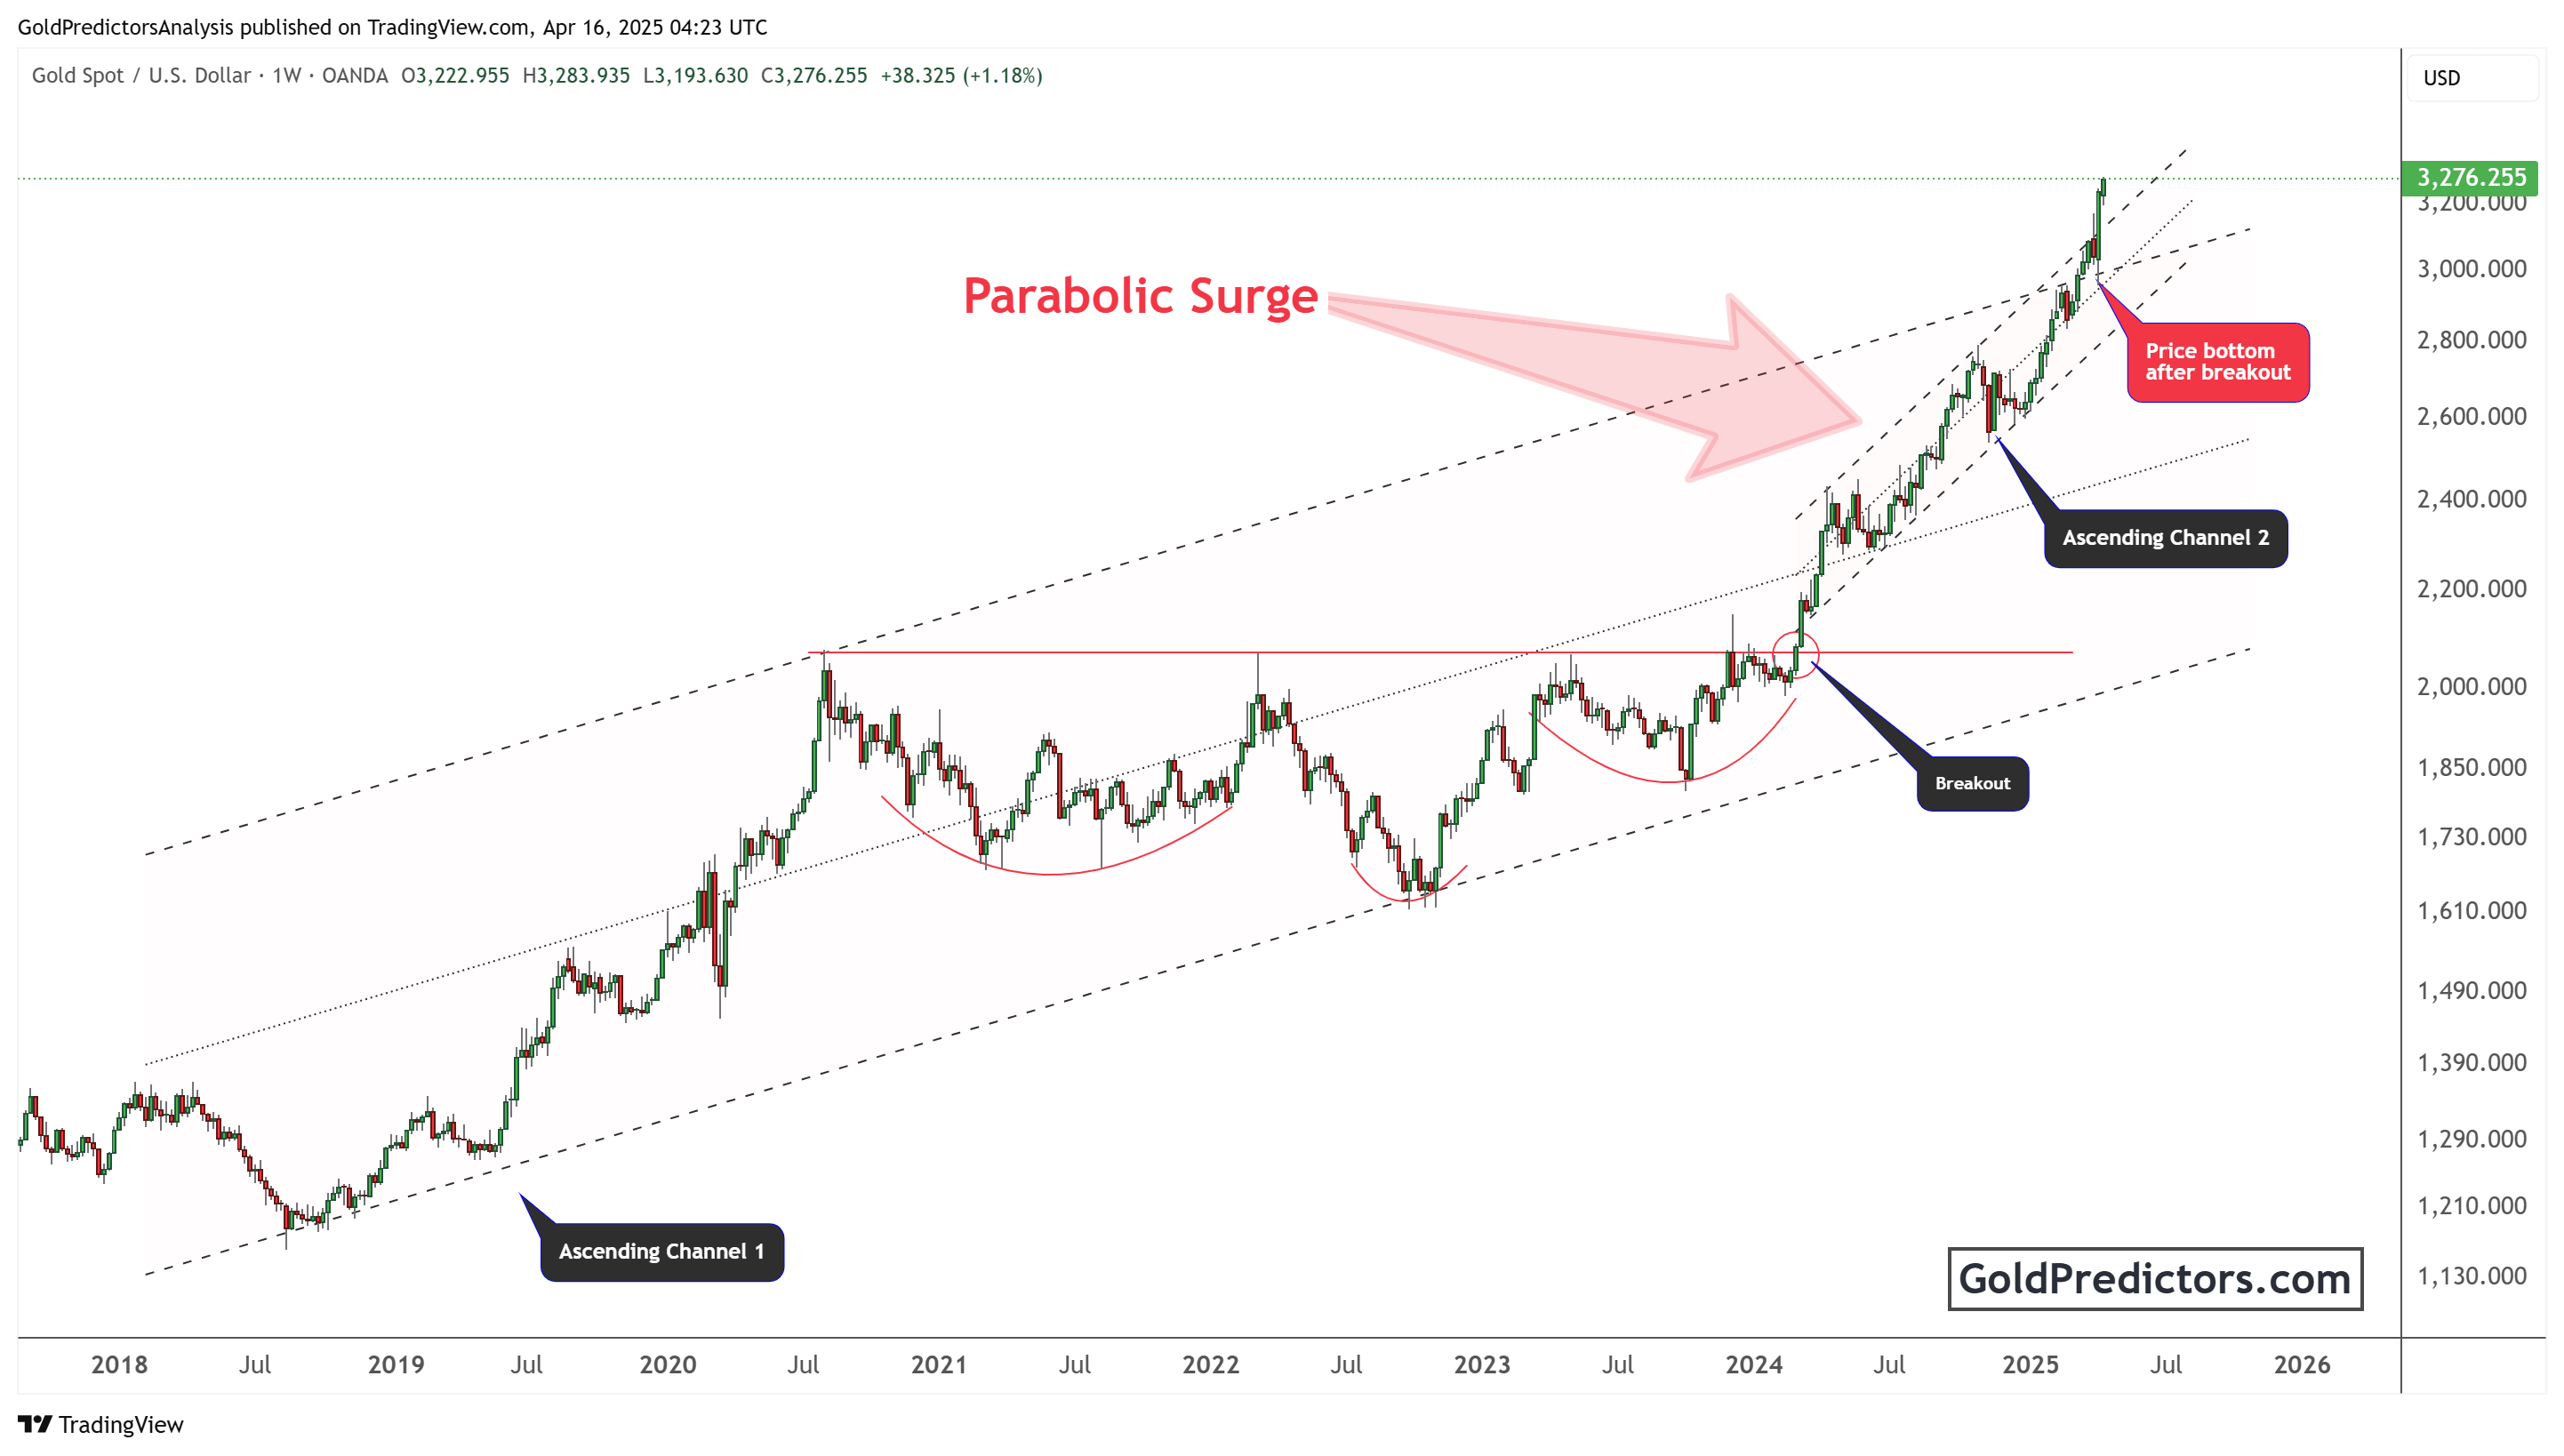
This breakout may mark the beginning of a new phase in the uptrend. However, with the price significantly above the upper trend line, a pullback or sideways consolidation is likely. Traders may take profits ahead of the weekend and amid tariff-related uncertainties.
The technical structure suggests that the bullish trend is intact. But after such a strong move, some correction is natural. The previous resistance level near $3,000 may act as support if prices dip again.
How to trade Gold during the crisis
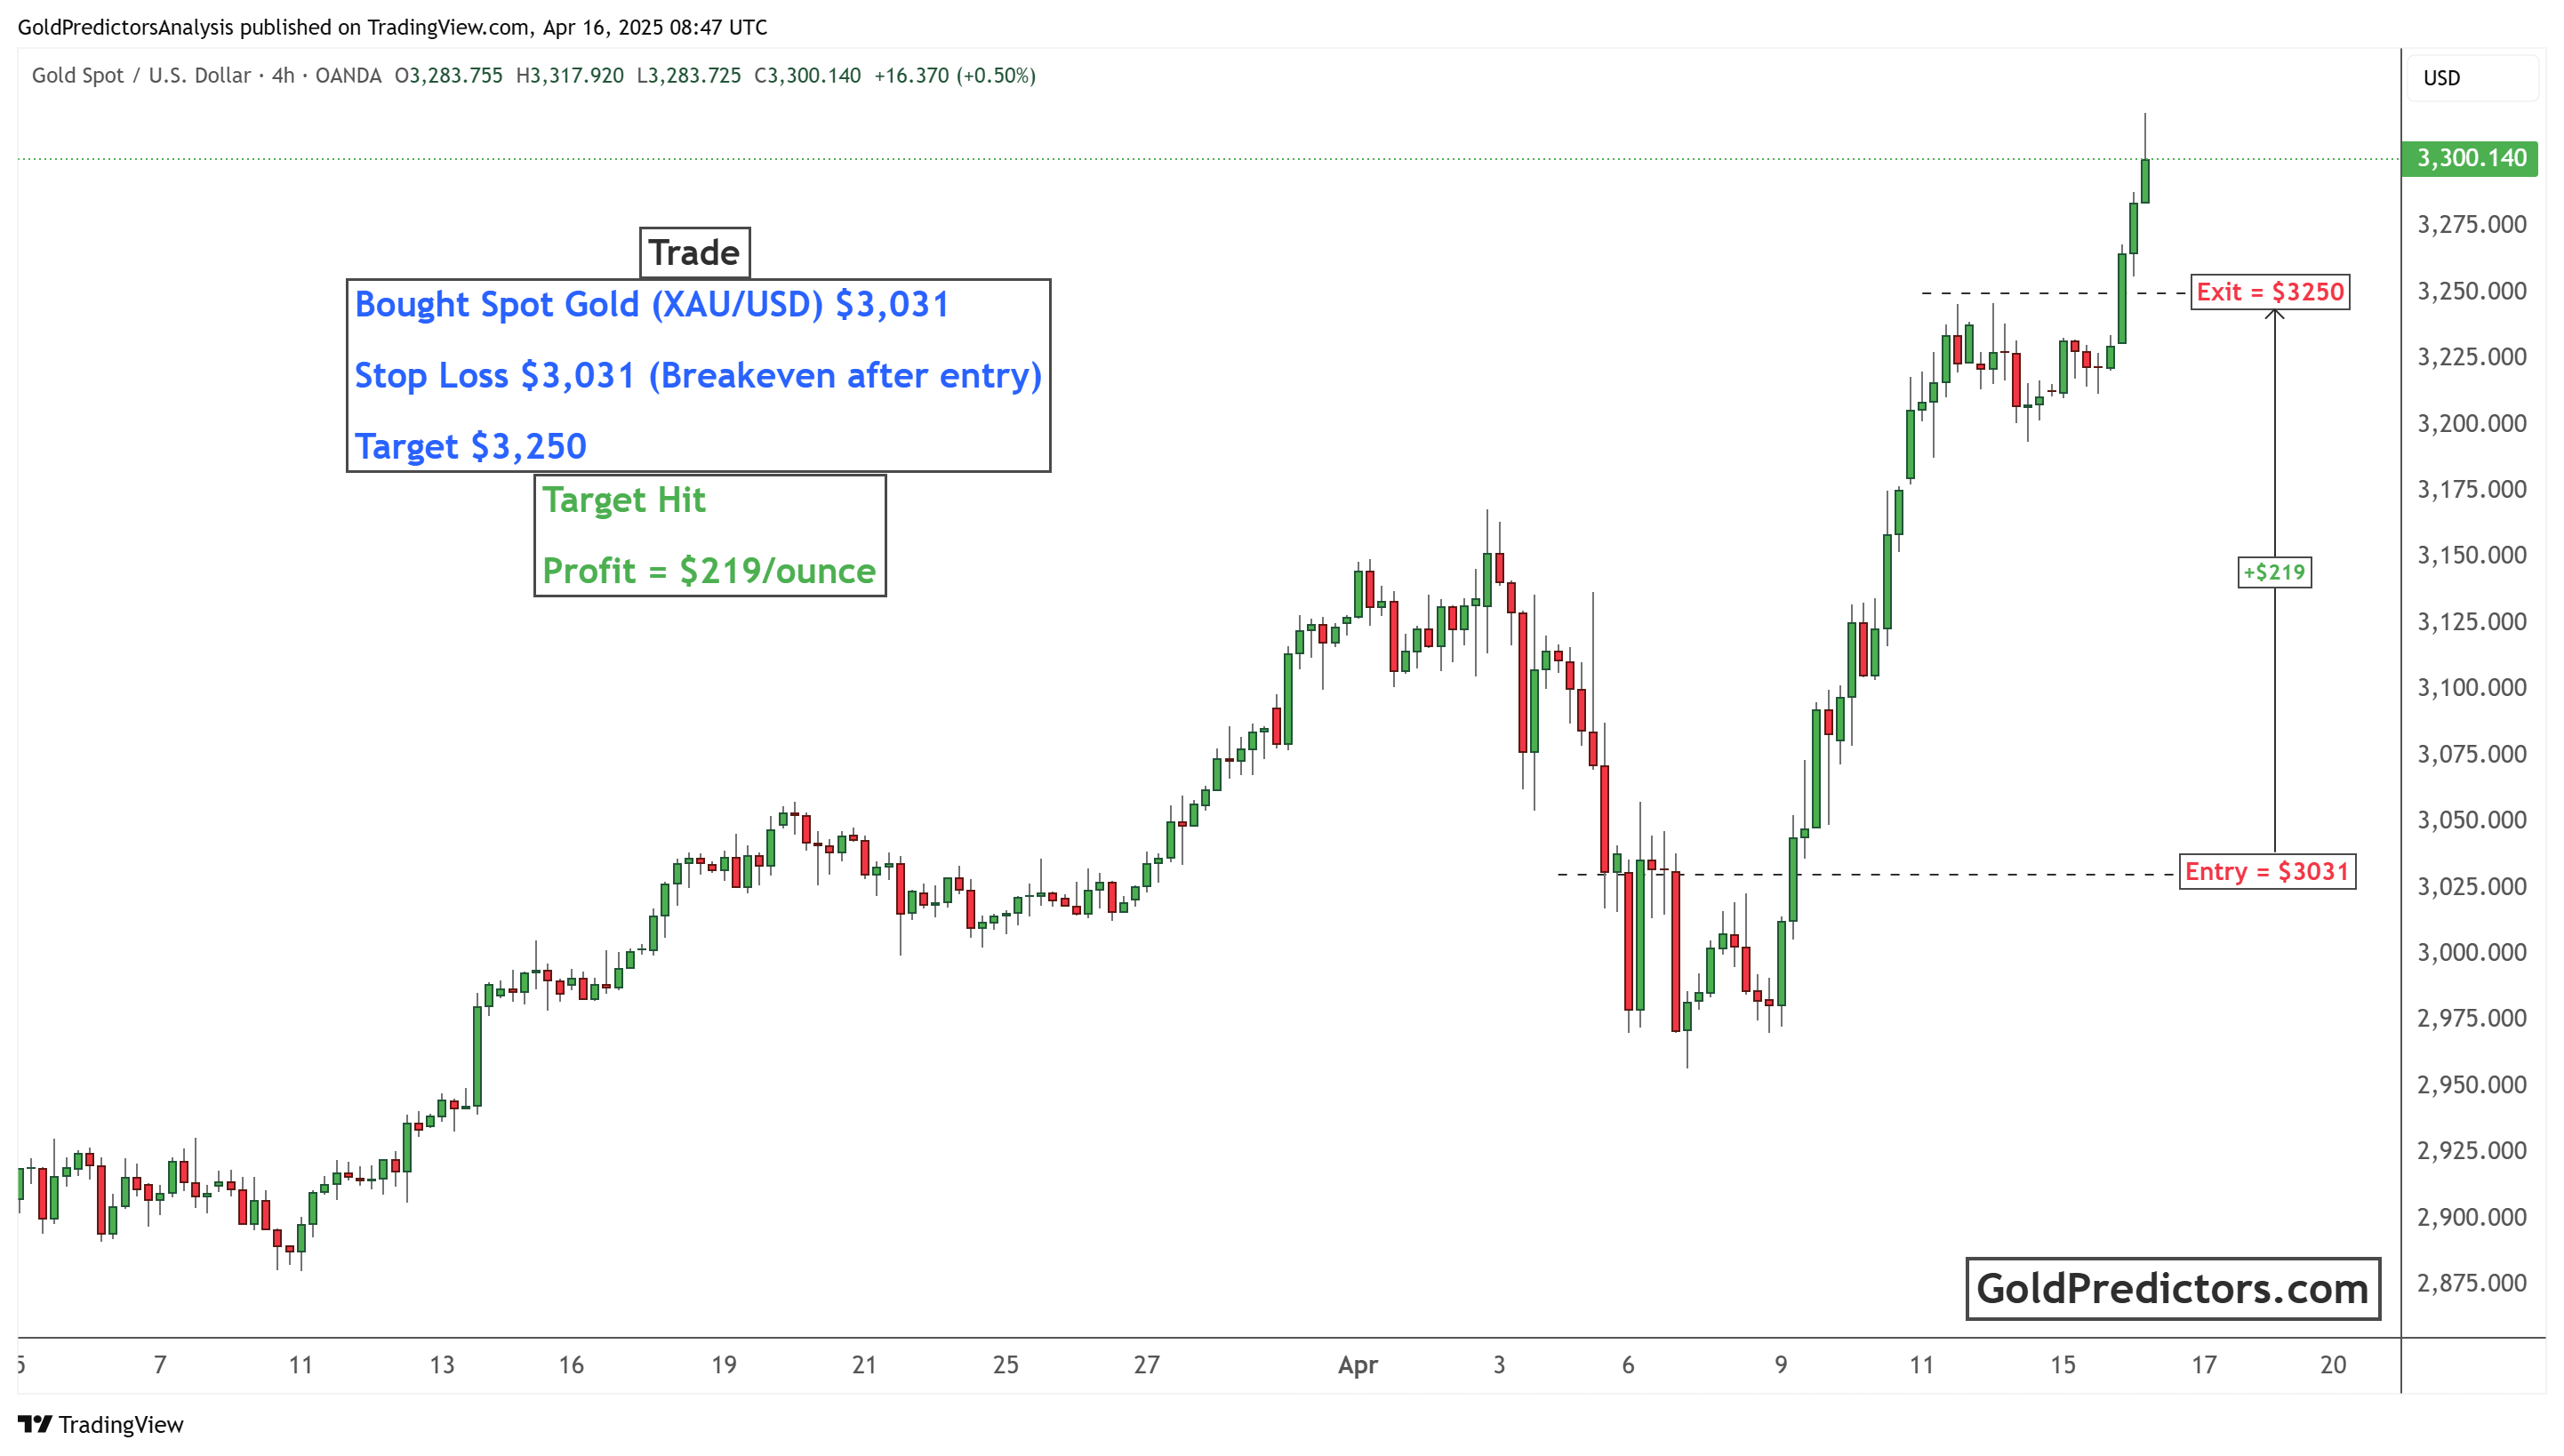
The chart below shows a real trade that demonstrates a clear method to profit from gold trading. The entry was made at $3,031 with a stop loss set at the same level, ensuring minimal risk. The target was set at $3,250. Once the price reached the target, the trade was closed, securing a profit of $219 per ounce. This setup highlights how traders should define their entry, stop loss, and take-profit levels clearly before entering a trade. This particular trade was shared on WhatsApp and successfully hit the target.
Conclusion
Gold's rise shows that investors are getting more worried about the world economy, trade problems, and unclear government policies. The chart shows a strong bullish pattern, supported by breakout signals and consistent demand. However, with prices stretched after a sharp move, a short-term correction is possible. Tariff tensions and investors taking profits could cause short-term ups and downs in the market. Traders should watch key support levels and await clearer signals before making fresh entries.
Unlock exclusive gold and silver trading signals and updates that most investors don’t see. Join our free newsletter now!
Unlock exclusive gold and silver trading signals and updates that most investors don’t see. Join our free newsletter now!
Author

Muhammad Umair, PhD
Gold Predictors
Muhammad Umair is a financial markets analyst and investor who focuses on the forex and precious metals markets.


