Gold prices drop as Fed signals no rate cuts and tariff risks increase

Gold (XAUUSD) faces renewed selling pressure as investors react to shifting monetary policy and trade developments. The Federal Reserve’s steady stance and a strong US jobs report have reduced hopes for a near-term rate cut. As a result, Treasury yields and the US Dollar have climbed, making gold less appealing. At the same time, Trump’s aggressive tariff plans have raised concerns about inflation and market uncertainty. These factors continue to weigh on gold, despite limited support from weak equities and global risk sentiment.
Gold prices slip as Fed holds steady and trade tariffs fuel inflation worries
Gold remains under selling pressure as markets adjust to the Federal Reserve's steady policy stance. Investors no longer expect a rate cut in July, especially after the strong US jobs report for June. This shift in expectations has pushed Treasury yields higher, making gold less attractive as a non-yielding asset. The US Dollar has also gained strength, reaching a two-week high and further weighing on gold prices.
The rise in US tariffs under Trump’s renewed trade agenda adds another layer of uncertainty. His threats to impose 200% tariffs on foreign drugs and 50% on copper signal a more aggressive trade war. These moves are expected to raise inflation, giving the Fed more reason to delay any policy easing. As a result, the dollar stays supported while gold struggles to find buying interest amid reduced safe-haven demand.
Despite the bearish bias, fragile global risk sentiment continues to offer some support to gold. Weak equity markets and worries about the economic impact of tariffs prevent a deeper gold selloff. Traders are also cautious ahead of the FOMC meeting minutes and upcoming Fed speeches. These events could influence expectations about future rate cuts and trigger fresh moves in the gold market.
Gold forms a symmetrical broadening wedge as momentum fades near $3,450
The gold chart below shows that after a strong rally from late 2024 through early 2025, gold’s bullish momentum has started to weaken in recent weeks. The price has begun to consolidate. This consolidation resulted in the formation of a Symmetrical Broadening Wedge pattern on the weekly chart. The pattern reflects a period of indecision following a strong uptrend.
The wedge is typically associated with increasing volatility and potential breakout scenarios. However, in this case, gold failed to break above the wedge with conviction. Price rejections near the $3,450 and $3,500 levels, marked by upper wicks and bearish candles, indicate strong selling pressure. This signals that bulls are losing momentum while bears are stepping in at key resistance zones.
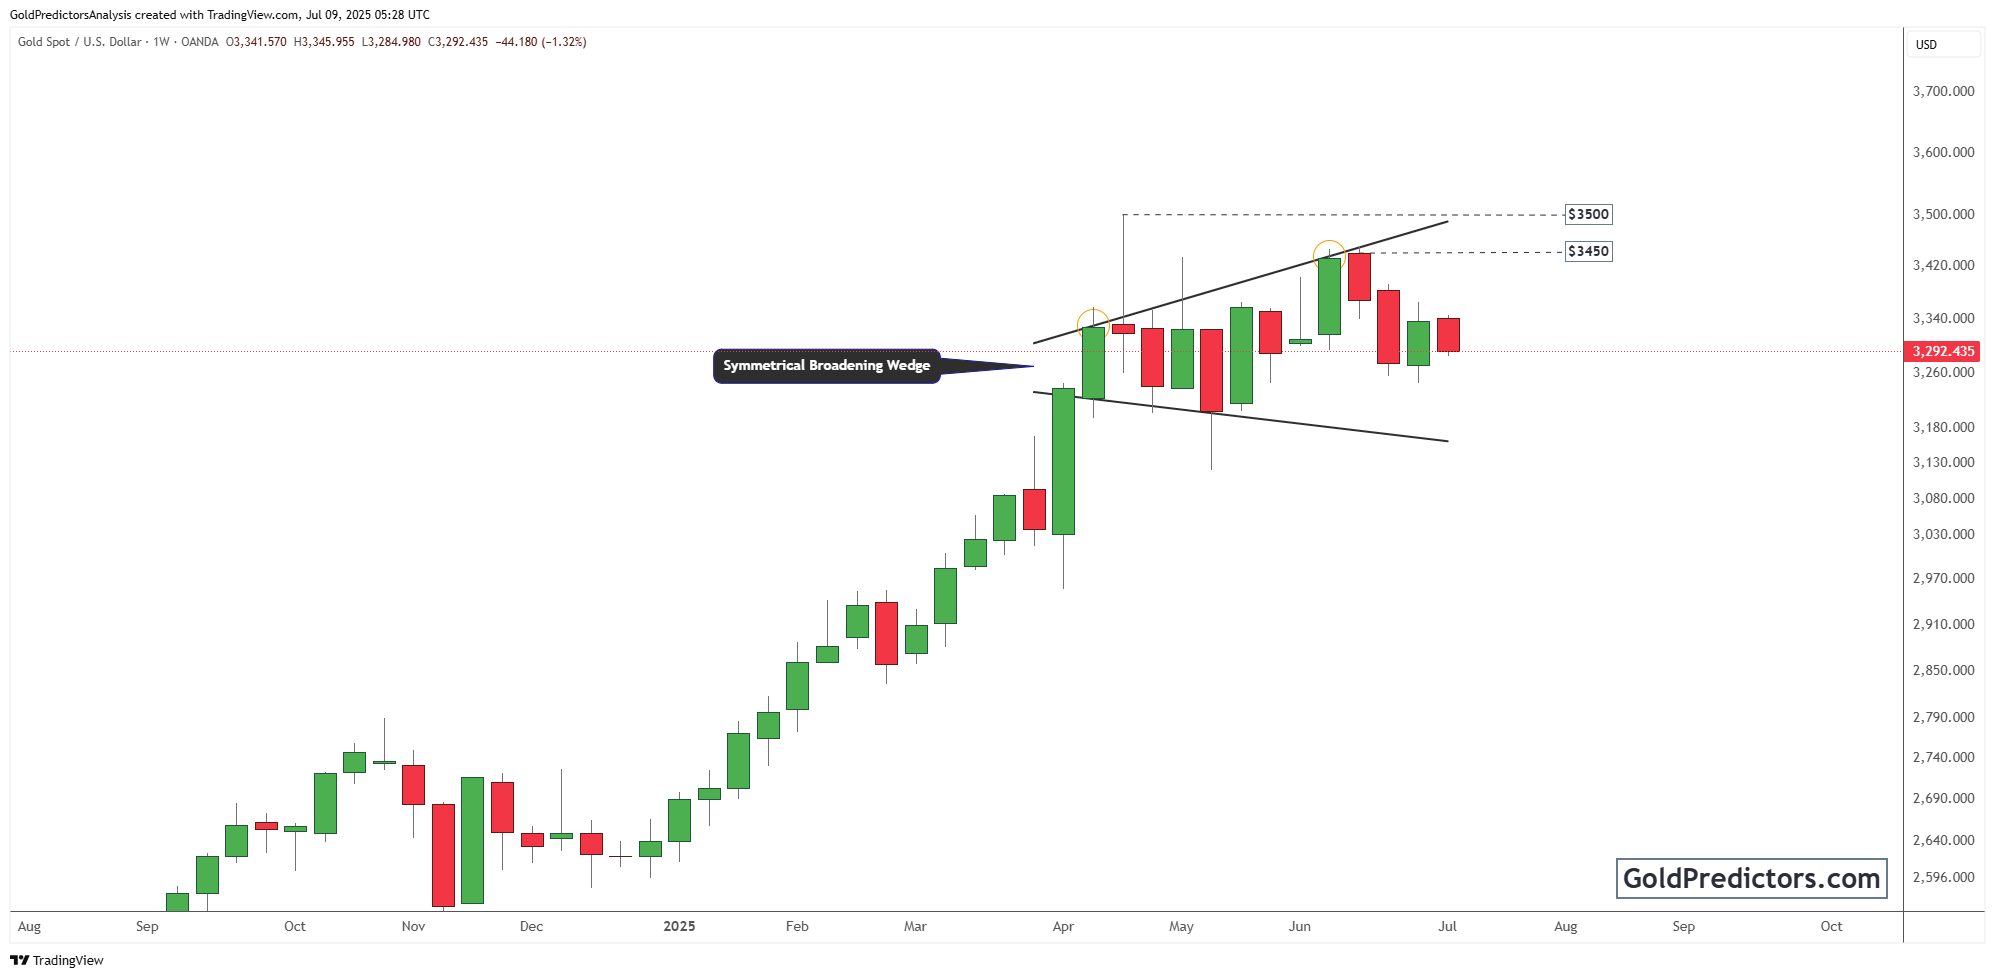
The market did attempt an upside breakout, but sellers quickly regained control around the $3,450 level, which now acts as strong resistance. On the downside, the wedge’s lower boundary offers dynamic support. A close below this level could trigger further losses, potentially reaching $3,180 or even $3,080. Current price action hovers near the midpoint of the wedge, indicating uncertainty. While the broader trend remains slightly bullish, short-term sentiment has turned bearish due to rising macroeconomic risks.
Conclusion
Gold remains under pressure as bearish sentiment deepens amid rising Treasury yields, a stronger US Dollar, and renewed trade policy fears. The metal’s failure to hold above key resistance and its current consolidation within a Symmetrical Broadening Wedge highlight market indecision. Sellers continue to dominate near the $3,450 zone, while downside risks grow with each failed rebound. With the Fed showing no urgency to cut rates and tariffs threatening further inflation, traders will closely watch upcoming Fed communications for clarity. Until then, gold is likely to stay range-bound with a bearish tilt.
Unlock exclusive gold and silver trading signals and updates that most investors don’t see. Join our free newsletter now!
Unlock exclusive gold and silver trading signals and updates that most investors don’t see. Join our free newsletter now!
Author

Muhammad Umair, PhD
Gold Predictors
Muhammad Umair is a financial markets analyst and investor who focuses on the forex and precious metals markets.















