Gold prices consolidate as US-EU tariff delay calms markets

Gold (XAU/USD) continues to trade within a narrow range as global investors evaluate conflicting economic cues. The optimism from delayed US-EU tariffs has slightly reduced the demand for safe-haven assets like gold. Conversely, concerns over US fiscal policy, monetary easing expectations, and geopolitical tensions support gold prices. The technical chart shows key formations that may influence future price movement.
Trump's tariff postponement briefly calms markets, but trade uncertainty lingers
Investors found temporary relief after US President Donald Trump announced a delay in the proposed 50% tariffs on the European Union. The extension, now set until July 9, followed discussions with EU President Ursula von der Leyen. Markets viewed the move as a positive development, slightly easing demand for safe-haven assets like gold.
However, the optimism may be short-lived. Trump’s trade policies remain unpredictable, and rising tensions with China continue to weigh on market sentiment. The risk of renewed trade disputes still looms, keeping investors cautious and potentially driving them back toward gold if tensions escalate further.
Meanwhile, in the U.S., Trump’s proposed “Big, Beautiful Bill” is expected to add approximately $4 trillion to the national deficit over the next decade. This has raised concerns over deteriorating fiscal conditions, with the Congressional Budget Office warning about long-term debt sustainability. At the same time, expectations of a Federal Reserve rate cut later this year have weakened the US Dollar. A weaker dollar supports gold prices, which are also underpinned by ongoing geopolitical tensions such as the Russia-Ukraine war and unrest in the Middle East. With key economic data releases—including the FOMC minutes, Q1 GDP, and the PCE Price Index—due later in the week, markets will likely remain cautious until clearer signals emerge.
Gold builds breakout energy: Triangle pattern and bullish reversal in focus
The gold chart below shows a clear symmetrical triangle pattern in the 4-hour timeframe. This pattern typically indicates consolidation before a breakout. Price action is compressing between converging trend lines, suggesting that a decisive move may be imminent.
Notably, an inverted head and shoulders formation appears within the lower part of the triangle. This bullish reversal pattern, completed around the $3,120–$3,160 zone, helped raise the price in recent sessions. The neckline breakout near $3,240 further supported bullish sentiment.
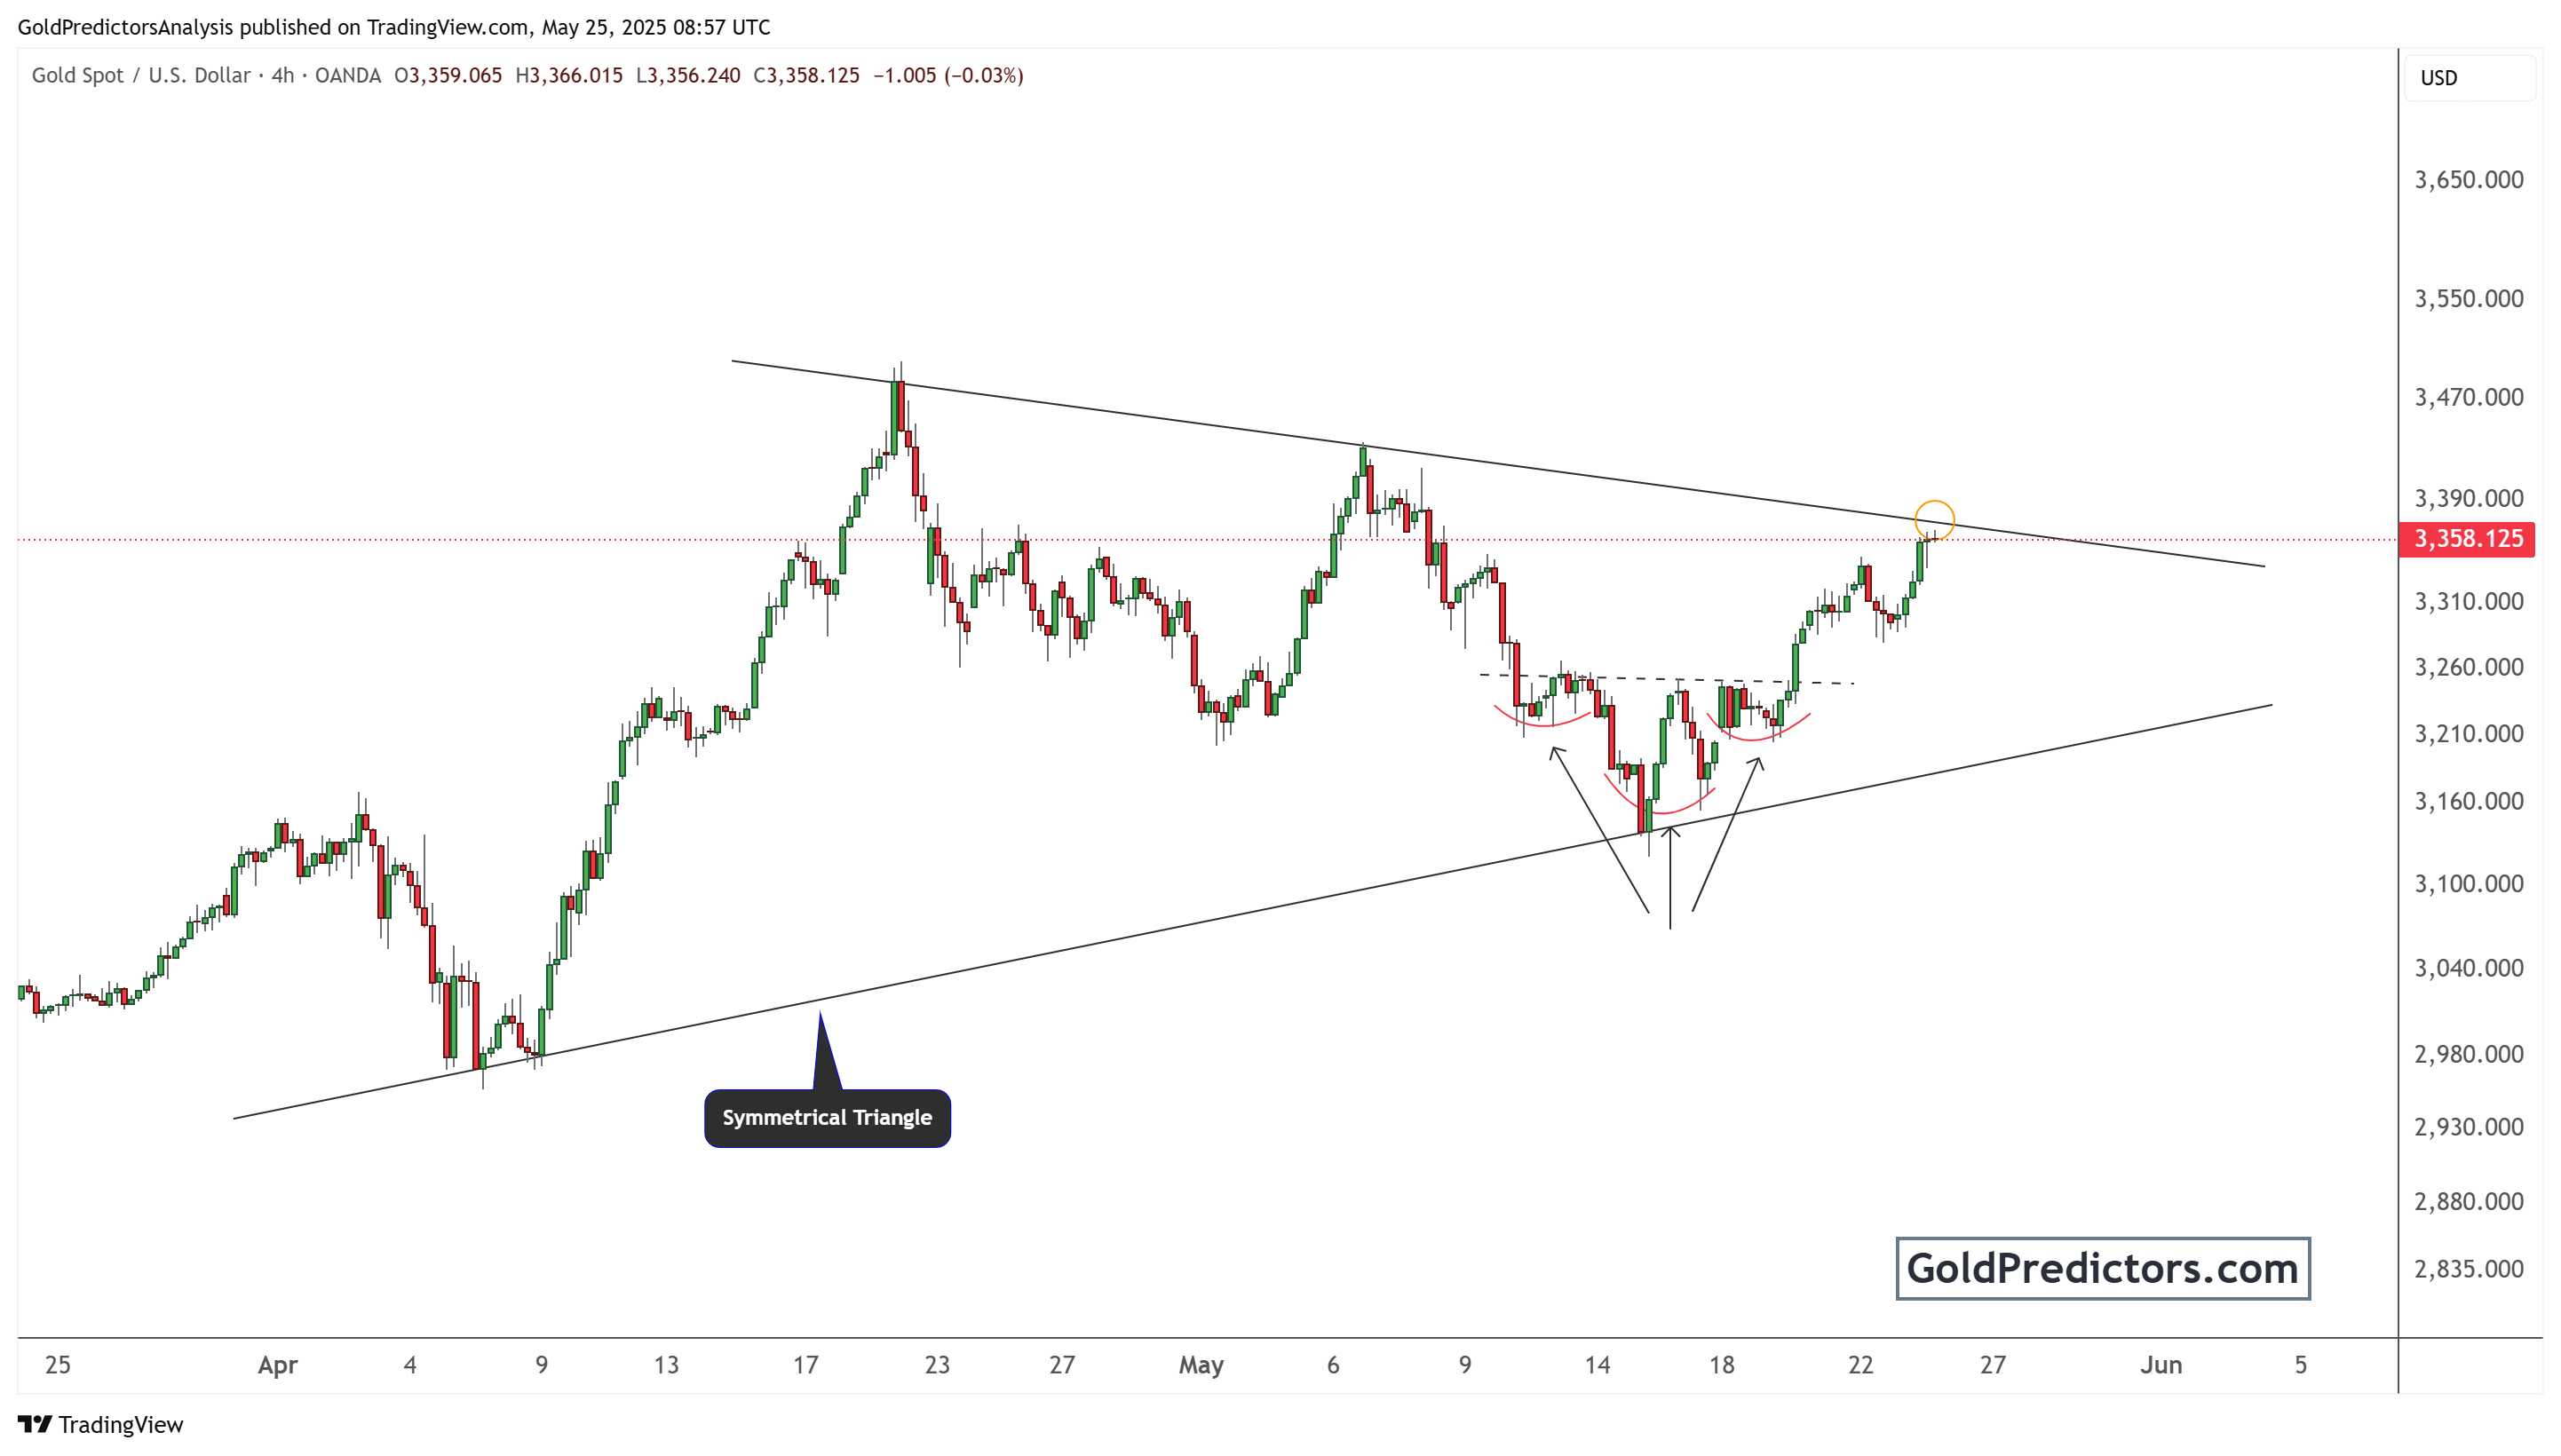
However, gold is now testing the upper boundary of the triangle, around the $3,330–$3,340 area. A strong close above this resistance could trigger bullish momentum, potentially targeting previous highs near $3,420. Conversely, rejecting this level could bring the lower trend line near $3,200 back into play.
Volume remains relatively muted, which suggests that traders are waiting for a fundamental catalyst before committing to new positions. A breakout accompanied by high volume would confirm the next directional move. Until that breakout occurs, gold is expected to continue consolidating within this triangular range.
Gold awaits breakout as mixed signals keep prices in tight range
Gold prices remain stuck in a tight range as traders weigh mixed global signals. Positive news like delayed U.S.-EU tariffs eases demand for safe havens, but concerns over US fiscal policy and geopolitical risks still support gold. Technically, gold nears a key breakout point within a symmetrical triangle. A clear move above or below will likely set the next trend. Until then, uncertainty keeps investors cautious and price action confined.
Unlock exclusive gold and silver trading signals and updates that most investors don’t see. Join our free newsletter now!
Author

Muhammad Umair, PhD
Gold Predictors
Muhammad Umair is a financial markets analyst and investor who focuses on the forex and precious metals markets.


