Gold Price ( Weekly , Daily , Hourly Analysis )

Weekly Analysis
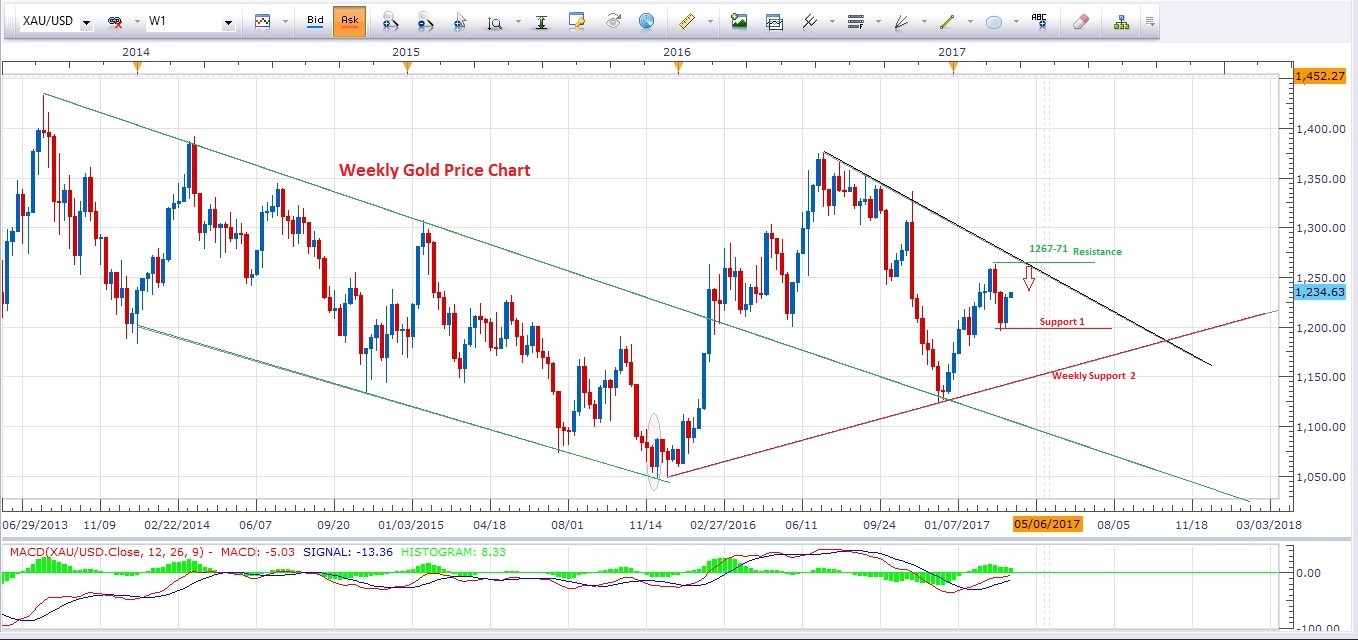
Engulfing candle closing from the support level provide more confidence to our bullish thoughts in a weekly time frame chart.The yellow metal next minor weekly resistance is at 1245-47 level, and the trend resistance is 1267-71.A small correction was expected before a new bounce, but it did not happen in the yesterday session.”Buying from dips in an uptrend is the key to gain high profit.” we will look for the better price levels to jump in for minimum target 1243-47 and maximum 1267-71. Daily and hourly charts may help us to catch the earliest movement.Please consider the weekly gold chart below to get the overview.
Weekly Chart
Daily Analysis
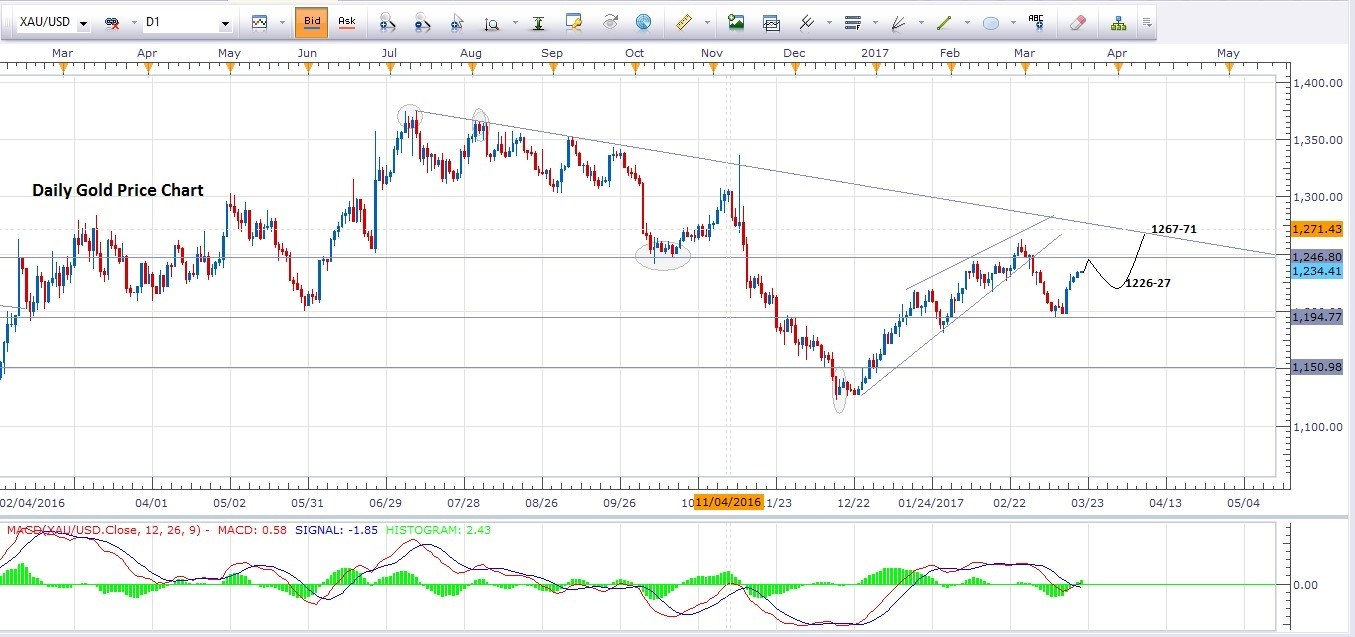
The gold continues in a bullish mode, and the immediate next resistance is at 1245-47 area which could be the watching area for correction.I am expecting a correction in a daily time frame from 1245-47 towards the 1225-26 minimum.Although if gold reverse back without hitting its next resistance level ,then we will look for bullish entry from 1218-19 level alternately.The longer term bullish target will remain same as long as gold is respecting its support levels.Please have a look at daily time frame gold chart below, I have draw a possible next movement diagram.
Daily Chart
Hourly Analysis
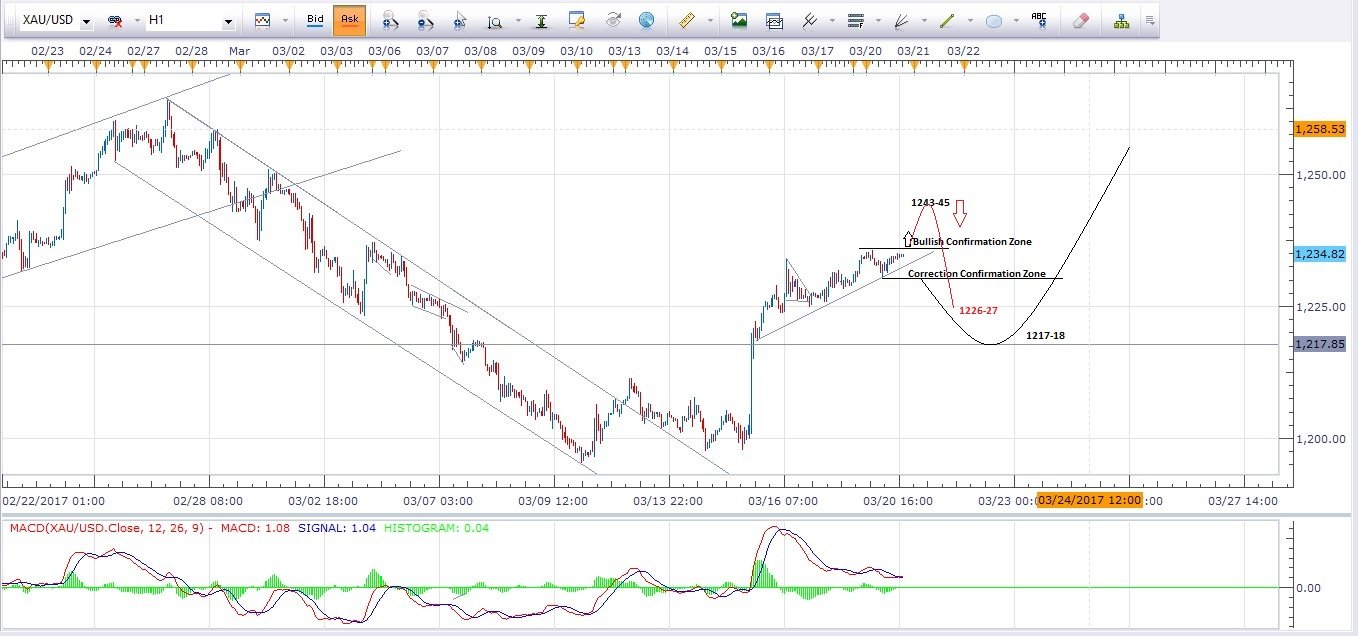
Hourly chart always gives us the close overview of trend and help us to catch the earliest spot to jump in the rally.Gold is slowly moving upside on an hourly chart.There is no single evidence of reversal from current market price.We will still look for the next resistance level to get the correction idea.Next resistance is at 1245-47 area.And expected correction level is 1226-27 after hitting the resistance level.
Alternately: If gold fail to touch the resistance and move back then we will look for the break of initial hourly support which is at 1229 level. Movement below 1229 will confirm the correction, and it could give us an opportunity to buy gold from the dip around 1218-17.
Note: The Trend is bullish, I have created two possible levels of correction in below chart.
Hourly Chart
Gold Support & Resistance 16th March
Resistance 1: 1243-45
Resistance 2: 1267-71
Support 1: 1226-27
Support 2: 1217-18
Wish you good luck and happy trading
Author

Mati Ur Rehman
DailyGoldAnalysis
Mati Ur Rehman is a seasoned forex trader with over 15 years of experience in the financial markets, specializing in technical analysis of gold and major currency pairs.


