Gold Price Forecast: XAUUSD looks set to test $1,800 after symmetrical triangle breakdown
- Gold Price attempts a bounce but is not out of the woods yet.
- USD cheers upbeat mood but recession fears loom as sentiment holds the key.
- Symmetrical triangle breakdown on the 4H chart points to more pain for XAUUSD.

Gold Price hit the lowest level in five days at $1,823 on Thursday, as bears fought back control following rejection once again above the critical $1,843 hurdle. It was a classic risk-off market profile, with recession fears mounting following disappointing euro area and US Business PMI readings. The US dollar demand as a safe-haven outshone and knocked down the bright metal by $15 on the day.
Although risk-off flows led the surge in the demand for US government bonds, the yields on the same tumbled and helped cap the downside in the non-yielding gold. Further, the Wall Street rebound, in the wake of falling yields and Fed Chair Jerome Powell’s optimism on the economic growth this year, limited the dollar’s upsurge and allowed gold bears to catch a breather. Powell, during his day 2 of testimony before the House Financial Services Committee on the Monetary Policy Report, said that the Fed is committed to bringing inflation back down and the American economy is very strong and well-positioned to handle tighter monetary policy.
Heading into the weekly close, gold price is attempting a minor comeback but remains within its familiar trading range of around $1,825. The greenback is trading choppy, with the bias slightly to the downside, as investors rethink the aggressive policy tightening expectations amid a looming recession. Calming nerves have brought some respite to the markets, allowing the yellow metal to recover its shine alongside the riskier assets.
With Powell’s testimony out of the way, the focus now shifts towards the sentiment surrounding the inflation and recession expectations, which will likely have a significant impact on the USD valuations and eventually on gold trades. There is no major economic data due on the cards from the US docket. Therefore, the revised Michigan Consumer Sentiment data and revised Michigan Inflation Expectations will be closed eyed. Also, the end-of-the-week flows could come into play, exaggerating the metal’s price moves.
Gold Price Chart: Four-hour
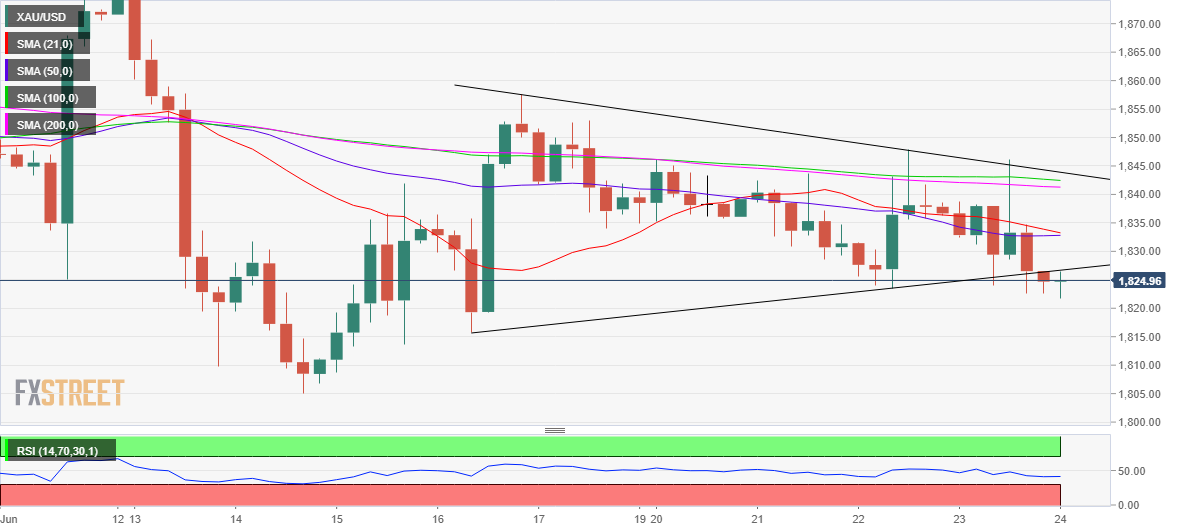
The precious metal witnessed a steep drop a day before after a 21 and 200 DMAs bearish crossover came into effect. Although losses remained capped around the $1,820 level, the sell-off did yield a bearish breakdown from a symmetrical triangle formation on the four-hour chart.
The Relative Strength Index (RSI) is inching lower below the midline on the said time frame, suggesting that there is more room to the downside. Adding credence to the bleak view, the 21-Simple Moving Average (SMA) is on the verge of cutting the 50 SMA lower. A bear cross remains in the offing, calling for a test of the June lows of $1805 on a firm break below the daily low of $1,822. Further down, the key $1,800 round figure will be put at risk.
On the upside, XAUUSD needs to recapture the triangle support now turned resistance at $1,827 to stage any meaningful recovery towards the confluence of the 21 and 50 SMAs at $1,833. A dense cluster of healthy resistance levels is stacked up around $1,843, which will be a tough nut to crack for XAU bulls. That level is the meeting point of the triangle resistance, 100 and 200 SMAs.
Author

Dhwani Mehta
FXStreet
Residing in Mumbai (India), Dhwani is a Senior Analyst and Manager of the Asian session at FXStreet. She has over 10 years of experience in analyzing and covering the global financial markets, with specialization in Forex and commodities markets.


