XAUUSD Current price: $1,729.91

  • A White House memo dismissing recession chances underpinned the market’s mood.
  • The greenback remains strong amid recession fears and ahead of US inflation data.
  • XAUUSD has room to test $1,676.73, the 2021 yearly low.

Gold Price remains under pressure on Tuesday, falling to $1,723.15 a troy ounce at the beginning of the day, a fresh 2022 low. Financial markets remain in a risk-off mood amid fears of a global recession in the middle of soaring inflationary pressures.

The dollar kept rallying as investors seek safety, although the greenback pared gains during the American session. A slightly better market mood came from a White House memo, which noted that US macroeconomic data, including the June jobs report, are not consistent with a recession. The document added that “labor market strength puts the US in a better position than many other countries to transition to lower inflation and steady growth.”

XAUUSD managed to bounce back and currently hovers around $1,730 as equities shrug off the early dismal sentiment. European indexes managed to post modest gains, while Wall Street trades in the green at the time being. At the same time, US Treasury yields eased from their weekly peaks as investors await US inflation figures.

The country will release the Consumer Price Index on Wednesday, which is expected to show inflation reached a new multi-decade high of 8.8% YoY in June. The core inflation reading, however, is expected to have eased from 6% to 5.8% in the same period.

Gold Price short-term technical outlook

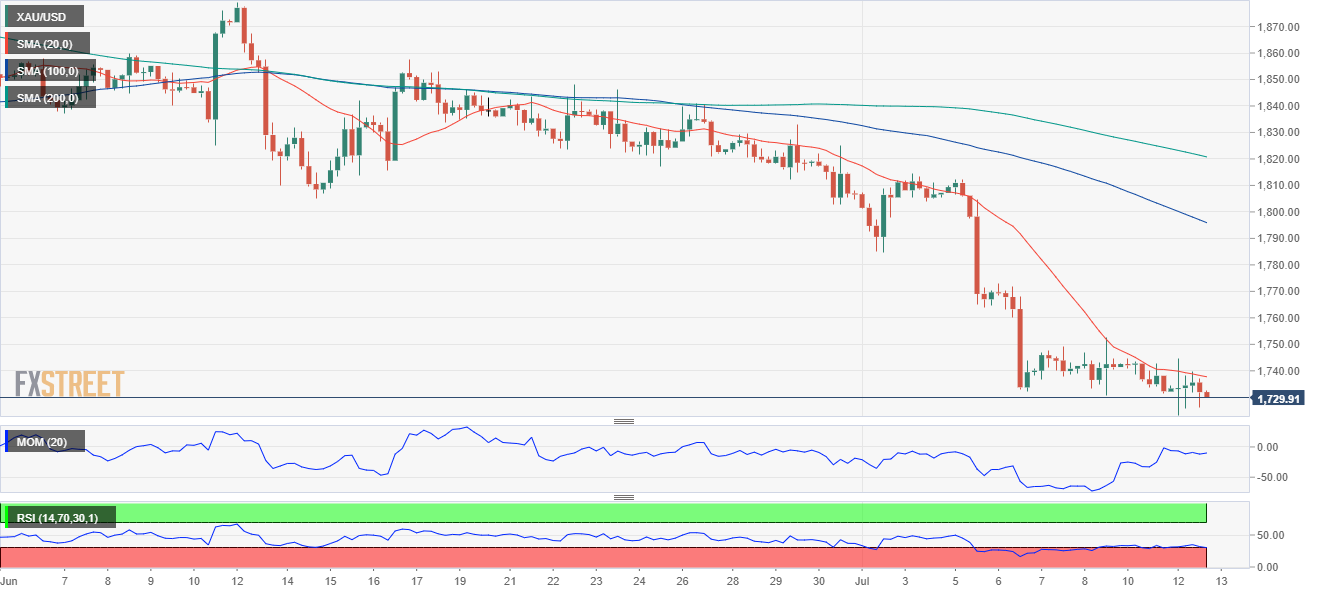
The daily chart for XAUUSD hints at persistent selling interest. The bright metal reached a lower low, far below bearish moving averages. Additionally, technical indicators have extended their declines within oversold territory without signs of bearish exhaustion.

Gold is neutral-to-bearish in the near term. The 4-hour chart shows that a bearish 20 SMA continues to cap advances, but losing its bearish strength. The longer moving averages, however, remain firmly bearish far above the shorter one. Technical indicators, on the other hand, remain flat within negative levels, lacking directional strength.

Support levels: 1,720.30 1,708.50 1,695.90

Resistance levels: 1,741.60, 1,752.50 1,765.00

Information on these pages contains forward-looking statements that involve risks and uncertainties. Markets and instruments profiled on this page are for informational purposes only and should not in any way come across as a recommendation to buy or sell in these assets. You should do your own thorough research before making any investment decisions. FXStreet does not in any way guarantee that this information is free from mistakes, errors, or material misstatements. It also does not guarantee that this information is of a timely nature. Investing in Open Markets involves a great deal of risk, including the loss of all or a portion of your investment, as well as emotional distress. All risks, losses and costs associated with investing, including total loss of principal, are your responsibility. The views and opinions expressed in this article are those of the authors and do not necessarily reflect the official policy or position of FXStreet nor its advertisers. The author will not be held responsible for information that is found at the end of links posted on this page.

If not otherwise explicitly mentioned in the body of the article, at the time of writing, the author has no position in any stock mentioned in this article and no business relationship with any company mentioned. The author has not received compensation for writing this article, other than from FXStreet.

FXStreet and the author do not provide personalized recommendations. The author makes no representations as to the accuracy, completeness, or suitability of this information. FXStreet and the author will not be liable for any errors, omissions or any losses, injuries or damages arising from this information and its display or use. Errors and omissions excepted.

The author and FXStreet are not registered investment advisors and nothing in this article is intended to be investment advice.

Recommended Content


Recommended Content

Editors’ Picks

EUR/USD clings to daily gains above 1.0650

EUR/USD clings to daily gains above 1.0650

EUR/USD gained traction and turned positive on the day above 1.0650. The improvement seen in risk mood following the earlier flight to safety weighs on the US Dollar ahead of the weekend and helps the pair push higher.

EUR/USD News

GBP/USD recovers toward 1.2450 after UK Retail Sales data

GBP/USD recovers toward 1.2450 after UK Retail Sales data

GBP/USD reversed its direction and advanced to the 1.2450 area after touching a fresh multi-month low below 1.2400 in the Asian session. The positive shift seen in risk mood on easing fears over a deepening Iran-Israel conflict supports the pair.

GBP/USD News

Gold holds steady at around $2,380 following earlier spike

Gold holds steady at around $2,380 following earlier spike

Gold stabilized near $2,380 after spiking above $2,400 with the immediate reaction to reports of Israel striking Iran. Meanwhile, the pullback seen in the US Treasury bond yields helps XAU/USD hold its ground.

Gold News

Bitcoin Weekly Forecast: BTC post-halving rally could be partially priced in Premium

Bitcoin Weekly Forecast: BTC post-halving rally could be partially priced in

Bitcoin price shows no signs of directional bias while it holds above  $60,000. The fourth BTC halving is partially priced in, according to Deutsche Bank’s research. 

Read more

Week ahead – US GDP and BoJ decision on top of next week’s agenda

Week ahead – US GDP and BoJ decision on top of next week’s agenda

US GDP, core PCE and PMIs the next tests for the Dollar. Investors await BoJ for guidance about next rate hike. EU and UK PMIs, as well as Australian CPIs also on tap.

Read more

Majors

Cryptocurrencies

Signatures