Gold Price Forecast: XAU/USD’s additional upside hinges on a daily close above 200-DMA
- Gold price eases from monthly tops amid bets of earlier Fed rate hike.
- Treasury yields attempt a bounce amid upbeat mood, focus shifts to US PPI.
- Gold price faces rejection at 200-DMA, will it manage to recapture it?

Indeed, the US September inflation reading emerged as that key catalyst, which prompted a range breakout in gold price after the week-long consolidative mode. Gold price caught a fresh bid wave on Wednesday, after the US Consumer Price Index (CPI) rose by 5.4% YoY vs 5.3% expectations, reinforcing growing concerns over rising price pressures. Gold price rallied as much as $40 on the CPI release to reach four-week highs at $1796, as the US dollar witnessed a squeeze amid ‘sell the fact’ trading. Further, investors brought forward the Fed rate hike expectation, as they believed the central bank could raise rates sooner to fight the rising inflationary pressures. This triggered a sharp sell-off in the longer-dated Treasury yields, leading to flattening of the yield curve and adding to the strength in gold price.
However, gold price stalled it's upside and entered a consolidative mode on the FOMC September meeting’s minutes. The minutes revealed that the Fed officials are ready to begin tapering in November or December this year. Also, the upbeat tone on Wall Street indices stemmed the gold price rally.
In the aftermath of the US CPI-led surge, gold price has corrected slightly from monthly highs amid a renewed uptick in the Treasury yields while the dollar licks it’s wounds across its main competitors. Gold bulls now remain wary amid increasing calls for an earlier Fed rate hike. Meanwhile, the Asian stocks are trading firmer, tracking the Wall Street optimism, as they add to gold’s pullback. Traders look forward to a fresh batch of the US economic releases and Fedspeak for fresh trading opportunities in gold price while the Fed sentiment will continue to lead the way.
Gold Price Chart - Technical outlook
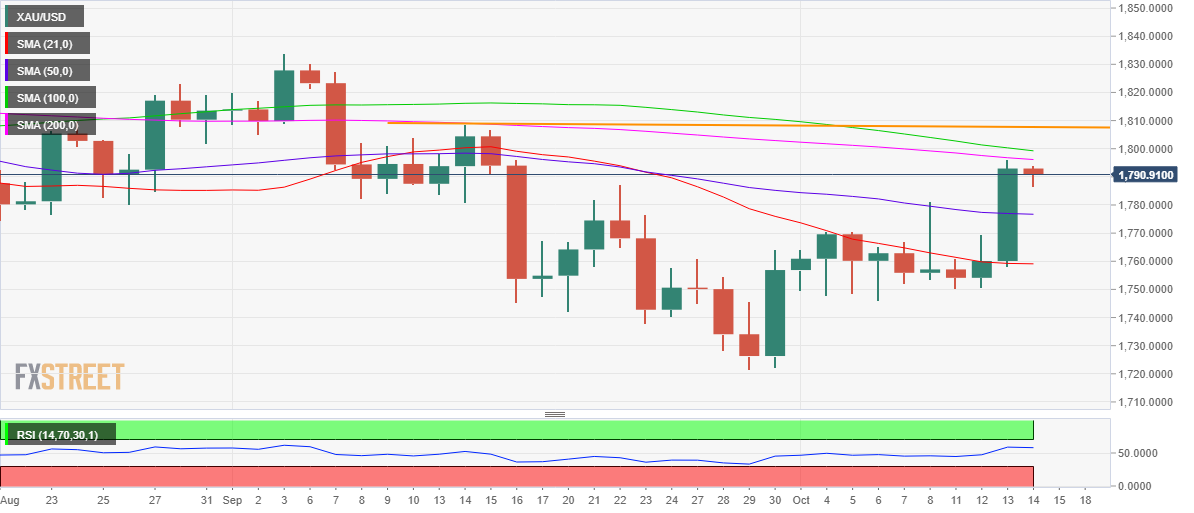
Gold: Daily chart
Tuesday’s closing above the short-term critical resistance of the 21-Daily Moving Average (DMA), at $1760 pointed to a turnaround towards a bullish sentiment in gold price.
The US CPI data delivered the much-needed impetus to traders, driving gold price past the downward-sloping 50-DMA at $1777, in order to test the all-important 200-DMA at $1797.
Going forward, any retracements will meet initial demand at the 50-DMA resistance-turned-support, below which the 21-DMA will come into play.
However, the 14-day Relative Strength Index (RSI) holds well above the 50.00 level, suggesting that any pullback will likely get bought into by the traders who feel that they have missed out on the recent rally.
On the topside, daily closing above the critical resistance around $1796-$1799 is needed to unleash additional upside in gold price. That price zone is the confluence of the bearish 100 and 200-DMAs.
The next relevant bullish target is envisioned near $1807-$1809, mid-September highs. If the latter gives way, then a fresh upswing towards the September highs of $1834 will be inevitable.
Author

Dhwani Mehta
FXStreet
Residing in Mumbai (India), Dhwani is a Senior Analyst and Manager of the Asian session at FXStreet. She has over 10 years of experience in analyzing and covering the global financial markets, with specialization in Forex and commodities markets.


