- US stimulus and vaccine optimism downs US dollar along with gold.
- 4H chart spots a potential descending triangle and bearish crossover.
- US stimulus talks closely followed ahead of Wednesday’s Fed decision.
Gold (XAU/USD) settled last week with modest losses below $1940, as the bears dominated amid fading hopes for a US coronavirus relief aid. Further, investors remained optimistic about the US Food and Drug Administration’s (FDA) authorization to Pfizer’s covid vaccine. Although the looming concerns over the virus growth on both sides of the Atlantic and no-deal Brexit fears cushioned the downside in the safe-haven gold.
The risk sentiment has improved starting out a fresh week, weighing on the yellow metal, as markets await the vaccine rollout in the US after the FDA authorization early Saturday. Further, renewed Brexit optimism after the talks extended past a Sunday deadline added to the upbeat market mood.
The vaccine optimism counters the likelihood of a US fiscal stimulus deal to be reached this week, rendering gold-negative. According to sources, a $908 billion bipartisan coronavirus relief package will be introduced in the US Congress as early as Monday. Also, gold traders remain jittery heading into the much-awaited and the final FOMC monetary policy decision of this year.
Gold Price Chart - Technical outlook
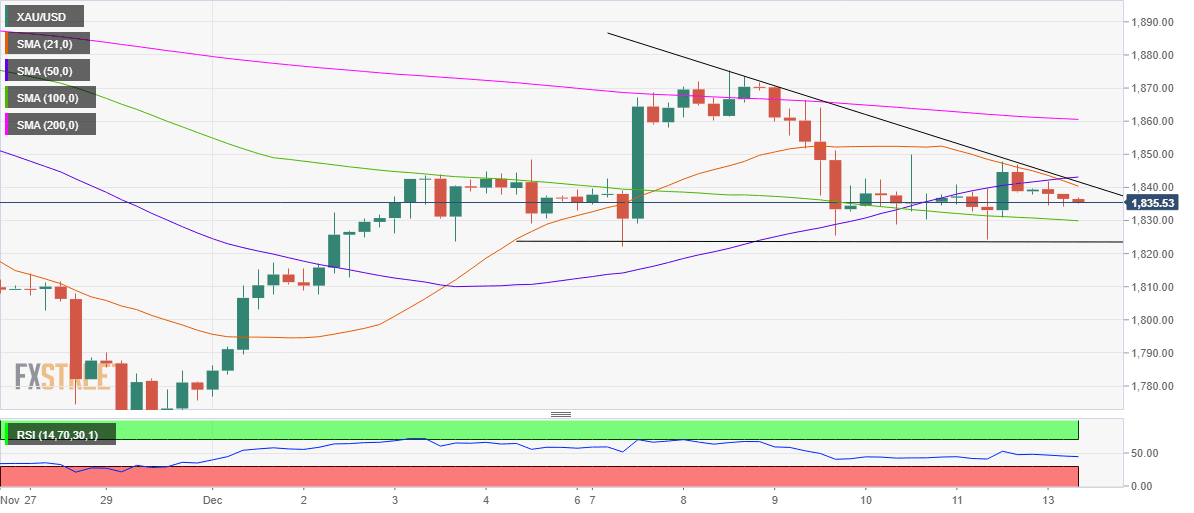
Gold: Four-hour chart
Looking at the four-hour chart, the outlook for gold remains downbeat in the coming sessions. The spot has carved out a descending triangle formation on the given timeframe, with the upside attempts capped by the confluence of the falling trendline resistance and bearish 21-simple moving average (SMA) at $1841, as of writing.
The sentiment has turned somewhat bearish, as the 21-SMA has pierced through the 50-SMA from above, confirming a bear crossover. Adding credence to the downside, the Relative Strength Index (RSI) point south (currently at 44.58) below the midline.
Immediate support awaits at the horizontal 100-SMA at $1830, below which the triangle support at $1823.50 could be tested.
Alternatively, a sustained break above the aforesaid critical resistance could confirm the descending triangle breakout and negate the recent downside bias. The XAU bulls could then challenge the 200-SMA at $1861.
Information on these pages contains forward-looking statements that involve risks and uncertainties. Markets and instruments profiled on this page are for informational purposes only and should not in any way come across as a recommendation to buy or sell in these assets. You should do your own thorough research before making any investment decisions. FXStreet does not in any way guarantee that this information is free from mistakes, errors, or material misstatements. It also does not guarantee that this information is of a timely nature. Investing in Open Markets involves a great deal of risk, including the loss of all or a portion of your investment, as well as emotional distress. All risks, losses and costs associated with investing, including total loss of principal, are your responsibility. The views and opinions expressed in this article are those of the authors and do not necessarily reflect the official policy or position of FXStreet nor its advertisers. The author will not be held responsible for information that is found at the end of links posted on this page.
If not otherwise explicitly mentioned in the body of the article, at the time of writing, the author has no position in any stock mentioned in this article and no business relationship with any company mentioned. The author has not received compensation for writing this article, other than from FXStreet.
FXStreet and the author do not provide personalized recommendations. The author makes no representations as to the accuracy, completeness, or suitability of this information. FXStreet and the author will not be liable for any errors, omissions or any losses, injuries or damages arising from this information and its display or use. Errors and omissions excepted.
The author and FXStreet are not registered investment advisors and nothing in this article is intended to be investment advice.
Recommended Content
Editors’ Picks
EUR/USD trades weak below 1.0800 amid Good Friday lull, ahead of US PCE
EUR/USD remains depressed below 1.0800 after soft French inflation data, amid minimal volatility and thin liquidity on Good Friday. The pair keenly awaits the US PCE inflation data and Fed Chair Powell's speech for fresh hints on next week's price action.
GBP/USD holds steady above 1.2600 as markets stay calm on Good Friday
GBP/USD trades sideways above 1.2600 amid a typical Good Friday trading lull. A broadly firmer US Dollar could keep any upside attempts limited in the pair ahead of the US PCE inflation data and Fed Chair Powell's appearance.
Gold reaches to all-time highs near $2,230, US PCE eyed
Gold price appreciates to all-time highs near $2,230 per troy ounce, attempting to continue its winning streak for the fifth successive session on Friday. However, trading volumes are light as market participants are likely observing Good Friday.
Jito price could hit $6 as JTO coils up inside this bullish pattern
Jito (JTO) price has been on an uptrend since forming a local bottom in early January. Since then, JTO has revisited the key swing point formed in early December, suggesting the bulls’ intention to move higher.
Key events in developed markets next week
Next week, the main focus will be inflation and the labour market in the Eurozone. We expect services inflation to be impacted by the easter effect, while the unemployment rate to be unchanged.