Gold Price Forecast: XAU/USD suffers from US inflation-led blow, downside appears limited
- Gold price consolidates US inflation-led losses, as the dust settles.
- US inflation rises to 7.5% YoY, ramps up Fed’s tightening bets.
- Golden cross, bullish RSI could keep the downside capped in gold.

It was a no brainer for traders on Thursday, as the US inflation came in hotter than expected and knocked down gold price, in what was seen as a correction from two-week highs of $1,842. However, it was quite a wild ride for the market participants, as the yellow metal tumbled to $1,822 in a knee-jerk reaction to the above-forecasts US Consumer Price Index (CPI) data, which arrived at 7.5% YoY in January vs. 7.3% expected.
The downtick in gold price was quickly reversed and bulls jumped back into the game and drove the quotes to fresh two-week highs. Sellers fought back control, thereafter, as the US dollar remained boosted by hefty Fed rate hike expectations in its March meeting alongside the US Treasury yields, in the face of the runaway price pressures. Further, hawkish comments from Fed's Bullard added to the bets on aggressive rate hikes, The benchmark 10-year yields jumped through the 2.0% key level, the highest level since August 2019. The inflation numbers spooked investors, which fuelled the risk-off trading on Wall Street and added to the upside in the safe-haven dollar, exacerbating the pain in gold price.
On the final trading day of the week, gold price is nursing losses amid persistent dollar strength and downbeat market mood. The US inflation concerns continue to weigh down on the Asian markets, limiting the losses in the bright metal while bears catch a breather. Expectations of aggressive Fed’s tightening will likely keep gold sellers cheerful, as the US rates hold at multi-year highs. Attention now turns towards the UK Q4 GDP, US Preliminary UoM Consumer Sentiment and Fed Monetary Policy Report for fresh trading opportunities in gold. In the meantime, the Fed sentiment will continue to lead the way.
Gold Price Chart - Technical outlook
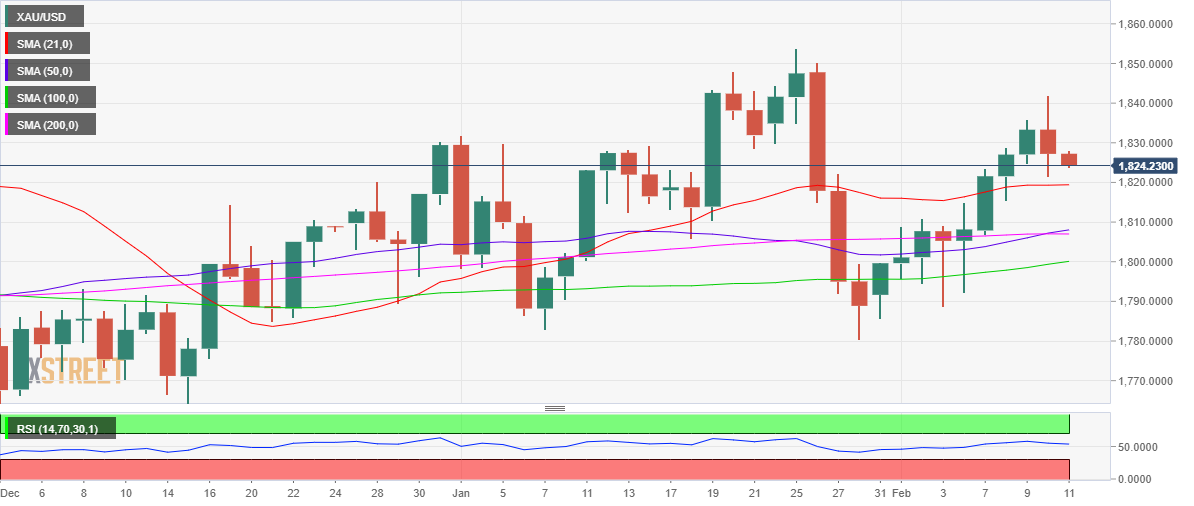
Gold: Daily chart
Gold price has room to extend the correction to the horizontal 21- Daily Moving Average (DMA) at $1,819 if Thursday’s low of $1,822 gives way.
Further down, the February 8 low of $1,815 will be on sellers’ radars.
The downside, however, appears limited for gold, as the golden cross remains in play while the 14-day Relative Strength Index (RSI) still holds above the central line.
The 50-Daily Moving Average (DMA) pierced through the 200-DMA from below on Thursday, confirming a golden cross on the said time frame.
On the upside, immediate resistance is seen at the round level of $1,830, above which Wednesday’s high of $1,836 will be probed.
Acceptance above the latter will call for a retest of the two-week highs above $1,840.
Premium
You have reached your limit of 3 free articles for this month.
Start your subscription and get access to all our original articles.
Author

Dhwani Mehta
FXStreet
Residing in Mumbai (India), Dhwani is a Senior Analyst and Manager of the Asian session at FXStreet. She has over 10 years of experience in analyzing and covering the global financial markets, with specialization in Forex and commodities markets.


