Gold Price Forecast: XAU/USD set to test key $1,775 support, as a big week kicks off
- Gold price remains vulnerable ahead of key central banks’ meetings, NFP.
- RBA and BOE to lean hawkish amid rising inflationary pressures.
- Gold’s path of least resistance appears down, per the daily chart.

Gold price registered the largest weekly fall in ten weeks, having settled Friday at $1,789 after reaching six-week troughs at $1,780. The bright metal extended its downward spiral into the third day in a row, undermined by the hawkish Fed’s narrative amid encouraging US growth numbers and surging PCE inflation. The aggressive Fed’s tightening expectations kept the bid tone intact around the Treasury yields, which boosted the US dollar rally. The US dollar index surged to the highest level since July 2020 at 97.44, with the month-end flows playing their part, as well. The greenback, however, failed to sustain at higher levels amid a stand-off on the Ukraine crisis and Apple Inc.’s earnings report, which sparked a risk-on rally on Wall Street. The dollar pullback heading into the weekly closing helped gold price bounce off sightly from the multi-week lows.
Gold price remains in the red zone for the fourth day in a row, starting out a big week this Monday. The dollar’s retreat extends due to an improvement in the risk sentiment, although brewing tensions on the Ukraine crisis keeps the downside cushioned in gold price. Russia added more troops around the Ukrainian border, as the US prepares to reach a deal on the Russian sanctions bill this week.
Investors turn cautious and refrain from creating fresh positions in the metal ahead of the key central banks’ decisions and the US Nonfarm Payrolls data. The Reserve Bank of Australia (RBA) is set to announce an end to its quantitative easing (QE) program on Tuesday while the Bank of England (BOE) is seen hiking the key rate by 25-bps on ‘Super Thursday’. Hawkish central banks’ outcomes could likely keep gold bulls at bay. In the meantime, gold price will remain at the mercy of the Fed and Wall Street sentiment, as the US data docket remains sparse on Monday.
Gold Price Chart - Technical outlook
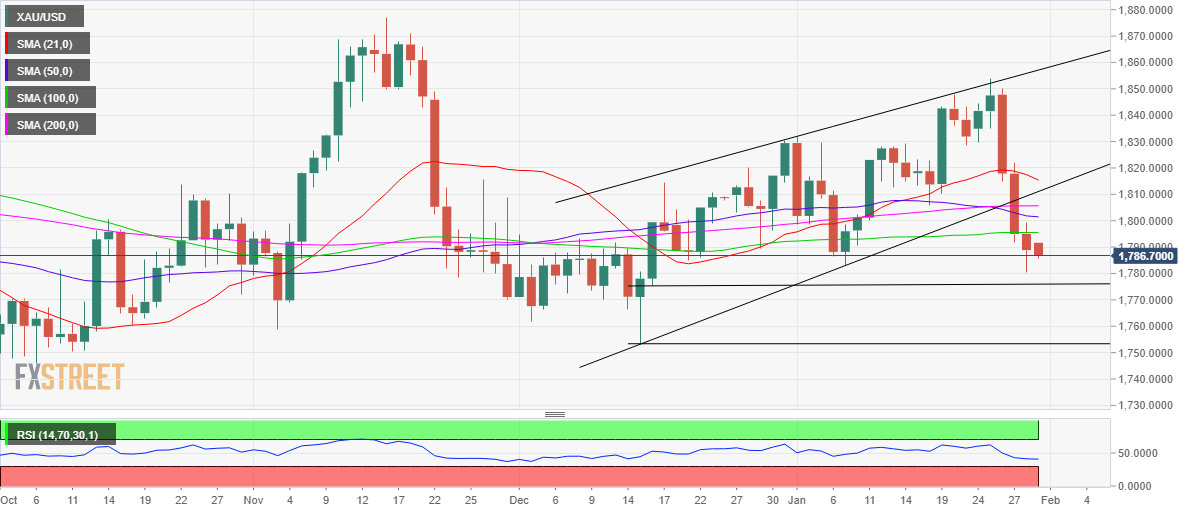
Gold: Daily chart
The bullish wedge confirmation in the previous week keeps the further downside exposed in gold price in the new week.
If Friday’s low of $1,780 gives way, then a test of the December 16 troughs of $1,776 will be imminent.
A sustained move below the latter will open floors towards the $1,750 psychological barrier.
The 14-Relative Strength Index (RSI) is inching lower below 50.00, backing the bearish view in gold price.
On the flip side, bulls will meet the horizontal 100-Daily Moving Average (DMA) initial hurdle at $1,795 on the road to recovery.
The next significant upside barrier is seen at the bearish 50-DMA, now pegged at $1,801, above which the 200-DMA at $1,806 will act as a strong supply zone.
Should the recovery momentum sustain, gold buyers will look out to test the wedge support-turned-resistance at $1,811.
Premium
You have reached your limit of 3 free articles for this month.
Start your subscription and get access to all our original articles.
Author

Dhwani Mehta
FXStreet
Residing in Mumbai (India), Dhwani is a Senior Analyst and Manager of the Asian session at FXStreet. She has over 10 years of experience in analyzing and covering the global financial markets, with specialization in Forex and commodities markets.


