Gold Price Forecast: XAU/USD set to extend the range play above $1800, with eyes on NFP
- Gold price remains pressured amid a broadly favored US dollar.
- Risk-off trading returns but gold price awaits US jobs data for fresh cues.
- Gold’s daily chart shows a lack of clear directional bias.

Gold price witnessed good two-way businesses and finished Monday little changed at $1814, having tested waters under the key short-term 21-Daily Moving Average (DMA) support, then at $1809. In the first half of the day, gold price rallied as high as $1820 amid a rebound in the risk sentiment, which weighed down on the safe-haven demand for the US dollar. Chinese stocks snapped their downtrend and jumped on hopes of more monetary support from the People’s Bank of China (PBOC) to stimulate the economic recovery, in light of the slowdown in the country’s manufacturing sector activity.
The tide turned in favor of the gold bears after the dollars staged a solid recovery in the American trading, as the US ISM Manufacturing PMI disappointed and re-ignited economic growth concerns, souring the market mood. However, surging coronavirus cases on both sides of the Atlantic and progress on the US infrastructure bill capped gold’s downside. The late decline in the US 10-year Treasury yields also comforted gold buyers, as they ignored the comments from Fed Governor Christopher Waller. Waller said that he could call for a tapering announcement by September if the next two monthly jobs reports show a continued uptrend.
On Tuesday, gold price is challenging the abovementioned key support once again, as the US dollar remains support amid the renewed risk-off market profile. China’s stock market return to the red zone, led by a sell-off in the stock prices of the online gaming companies after Chinese state media referred to their business as "spiritual opium". Meanwhile, most of the major Asian economies are fighting the covid battle hard amid a relentless surge in cases, limiting gold’s decline. Investors refrain from placing any directional bets on gold price ahead of the critical US jobs report due later this week, which will have strong implications on Fed’s next policy action and the dollar valuations. In the meantime, the broader market sentiment and the US Factory Orders data will be closely eyed for some trading impetus.
Gold Price Chart - Technical outlook
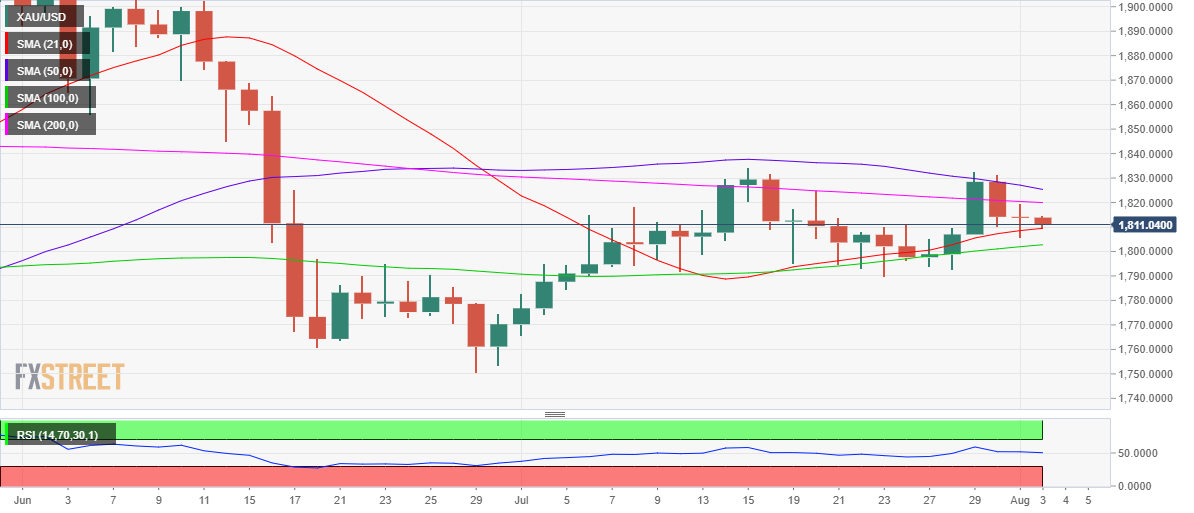
Gold: Daily chart
The daily chart of gold price shows that its trading range is getting tighter each passing day, with a breakout in either direction likely on the cards.
The 200-DMA at $1820 restricts the bullish attempts while the 21-DMA guards the downside. However, gold traders are biding time before the key event risks for this week – the US payrolls data.
The Relative Strength Index (RSI) is trading at coin flips levels, unable to suggest a clear directional bias, as of writing.
On the upside, gold price could test the mildly bearish 50-DMA at $1825 if it finds acceptance above the 200-DMA barrier. Further up, the July highs at $1834 could be challenged.
Meanwhile, a sustained break below the 21-DMA support could expose the ascending 100-DMA cap at $1803, below which the sellers will keep their sight on $1800.
The next significant downside target is envisioned around $1790, the recent range lows.
Author

Dhwani Mehta
FXStreet
Residing in Mumbai (India), Dhwani is a Senior Analyst and Manager of the Asian session at FXStreet. She has over 10 years of experience in analyzing and covering the global financial markets, with specialization in Forex and commodities markets.


