Gold Price Forecast: XAU/USD sellers refuse to give up, as focus shifts to US PCE inflation
- Gold price extends the decline on Thursday, despite a risk-on market mood.
- The US Dollar tracked US Treasury bond yields higher on reducing bets for Fed rate cuts.
- The daily RSI flips bearish again, as Gold price challenges the key 50-day SMA support at $2,324.

Gold price is seeing fresh selling near $2,330, extending the previous decline early Thursday. The US Dollar (USD) gains further ground, exerting downside pressure on the Gold price. Markets eagerly look forward to a fresh batch of US economic data and more US Federal Reserve (Fed) policymakers’ speeches for fresh policy cues.
Gold price remains at the mercy of the Fed expectations
Gold price fell into the red for the first time this week, heavily undermined by the market’s growing skepticism that the Fed will cut interest rates more than once in 2024. According to the CME FedWatch Tool, markets are pricing about 53% odds that the Fed will hold rates in September while the probability of a November rate cut stands at around 60%.
The recent hawkish Fed commentary and policymakers’ concerns on inflation persistence have diminished the odds for aggressive Fed rate cuts, fuelling the extended rally in the US Treasury bond yields while reviving the US Dollar against its major competitors.
Furthermore, mounting tensions that the Israel-Hamas conflict could turn into a wider regional conflict keep the risk-off flows intact, especially after CNN reported on Wednesday that The Israeli military said on Wednesday that it established “operational control” over the Philadelphi Corridor, a 14-kilometer (8.7 miles) strip of land along the border between Gaza and Egypt.
Looking ahead, the US Dollar will continue to draw haven demand amid rife Middle East tensions, acting as a headwind to the Gold price. Additionally, the focus remains on the second estimate of the Q1 US Gross Domestic Product (GDP) data, weekly Jobless Claims and Pending Home Sales data alongside speeches from New York Fed President John Williams and Dallas Fed President Lorie Logan.
The data publication and the Fedspeak could help the market gauge the timings of the potential Fed rate cuts this year, impacting the value of the US Dollar and the non-interest-bearing Gold price.
Gold price technical analysis: Daily chart
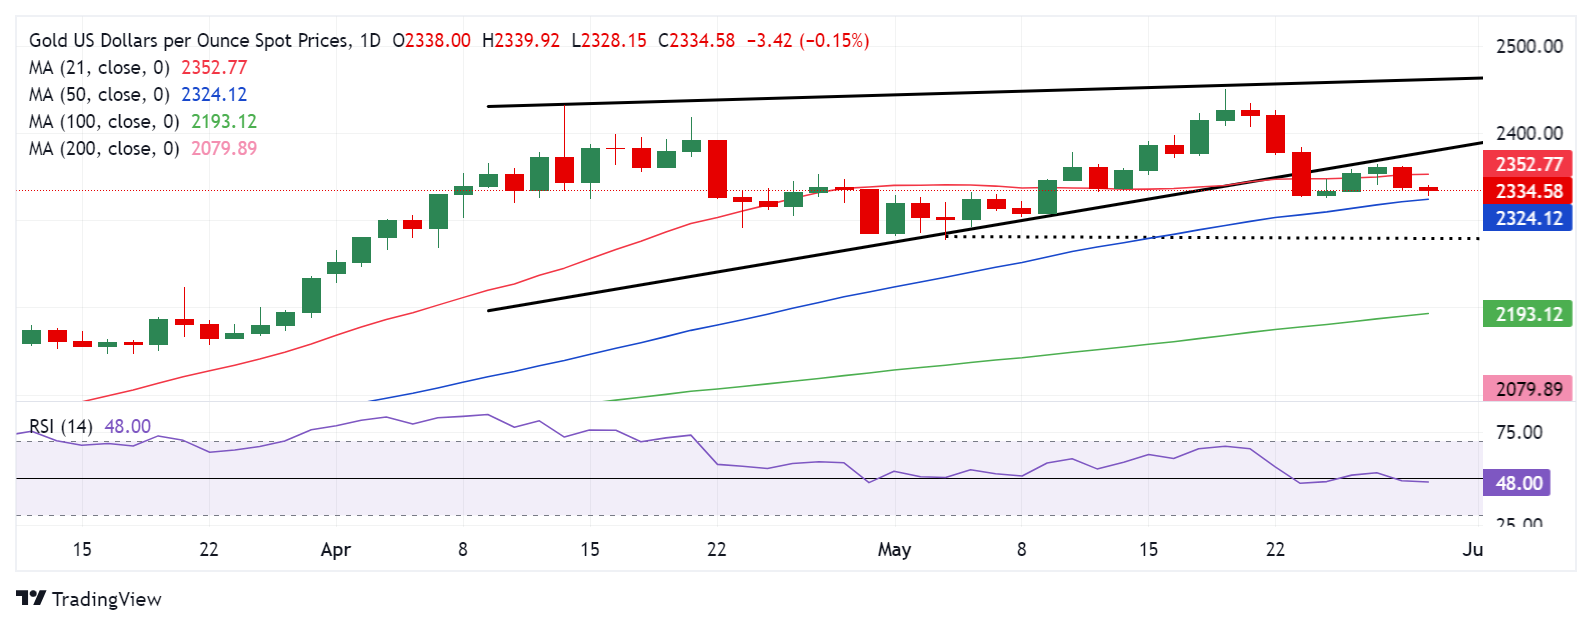
Gold price once again failed at the rising wedge support-turned-resistance, then at $2,372, and turned south on Wednesday.
The 14-day Relative Strength Index (RSI) snapped its bullish momentum and flipped into bearish territory, recalling Gold sellers.
At the moment, the RSI points lower below the 50 level, near 48.00, implying more downside for Gold price.
However, Gold sellers need to crack the 50-day SMA support at $2,324 to initiate a fresh downtrend toward the $2,300 threshold.
The next key downside cap is seen at the May 3 low of $2,277.
On the flip side, If Gold price bounces off the 50-day SMA at $2,324, the immediate resistance will be seen at the 21-day SMA support-turned-resistance at $2,353.
A sustained move above the abovementioned barrier at $2,372 would provide legs to the recovery, calling for a test of the next topside barrier at the May 24 high of $2,384.
Gold FAQs
Gold has played a key role in human’s history as it has been widely used as a store of value and medium of exchange. Currently, apart from its shine and usage for jewelry, the precious metal is widely seen as a safe-haven asset, meaning that it is considered a good investment during turbulent times. Gold is also widely seen as a hedge against inflation and against depreciating currencies as it doesn’t rely on any specific issuer or government.
Central banks are the biggest Gold holders. In their aim to support their currencies in turbulent times, central banks tend to diversify their reserves and buy Gold to improve the perceived strength of the economy and the currency. High Gold reserves can be a source of trust for a country’s solvency. Central banks added 1,136 tonnes of Gold worth around $70 billion to their reserves in 2022, according to data from the World Gold Council. This is the highest yearly purchase since records began. Central banks from emerging economies such as China, India and Turkey are quickly increasing their Gold reserves.
Gold has an inverse correlation with the US Dollar and US Treasuries, which are both major reserve and safe-haven assets. When the Dollar depreciates, Gold tends to rise, enabling investors and central banks to diversify their assets in turbulent times. Gold is also inversely correlated with risk assets. A rally in the stock market tends to weaken Gold price, while sell-offs in riskier markets tend to favor the precious metal.
The price can move due to a wide range of factors. Geopolitical instability or fears of a deep recession can quickly make Gold price escalate due to its safe-haven status. As a yield-less asset, Gold tends to rise with lower interest rates, while higher cost of money usually weighs down on the yellow metal. Still, most moves depend on how the US Dollar (USD) behaves as the asset is priced in dollars (XAU/USD). A strong Dollar tends to keep the price of Gold controlled, whereas a weaker Dollar is likely to push Gold prices up.
Author

Dhwani Mehta
FXStreet
Residing in Mumbai (India), Dhwani is a Senior Analyst and Manager of the Asian session at FXStreet. She has over 10 years of experience in analyzing and covering the global financial markets, with specialization in Forex and commodities markets.