Gold Price Forecast: XAU/USD sellers likely in control whilst below 21-day SMA
- Gold price reverses the previous rebound from weekly lows early Wednesday.
- The US Dollar stays defensive on inflation cooldown amid trade talks in focus.
- Gold price needs acceptance above the 21-day SMA for a sustained recovery.

Gold price is reversing a part of the previous rebound from weekly lows early Wednesday as sellers attempt to regain control amid optimism over potential US trade deals with some of its major trading partners.
Gold price keeps an eye on trade developments
Despite a cooldown in the US Consumer Price Index (CPI) data for April, a push back against expectations of the next interest rate cut by the US Federal Reserve (Fed) from July to September seems to be acting as a headwind to the non-interest-bearing Gold price.
US CPI increased 0.2% month-over-month (MoM) last month, data published by the Bureau of Labor Statistics (BLS) showed on Tuesday, missing the expected 0.3% growth. Annually, US CPI rose 2.3% in the same period, compared to a forecast of 2.4%.
Following the US-China trade truce, markets are now pricing in only 50 basis points (bps) of interest rate cuts this year, with the odds of a 25 bps rate cut in September standing at 50%.
Additionally, markets remain hopeful of further US trade deals with India, Japan, South Korea, etc, after the recent US-UK trade agreement and a 90-day pause on tariffs with China. The ongoing positive turn in risk sentiment, combined with receding recession fears, remains a drag on the traditional safe-haven Gold price.
The US and China agreed that the former would reduce levies on Chinese imports from 145% to 30% during a 90-day negotiation period, and China would lower duties from 125% to 10%.
Furthermore, hopes of progress on the Russia-Ukraine peace talks due on Thursday also undermine the sentiment around the bright metal.
Looking ahead, Gold price could resume its corrective decline as the US Dollar (USD) stabilizes after the previous sell-off. However, trade talks are likely to remain the main driver amid a lack of top-tier US economic data releases.
Gold price technical analysis: Daily chart
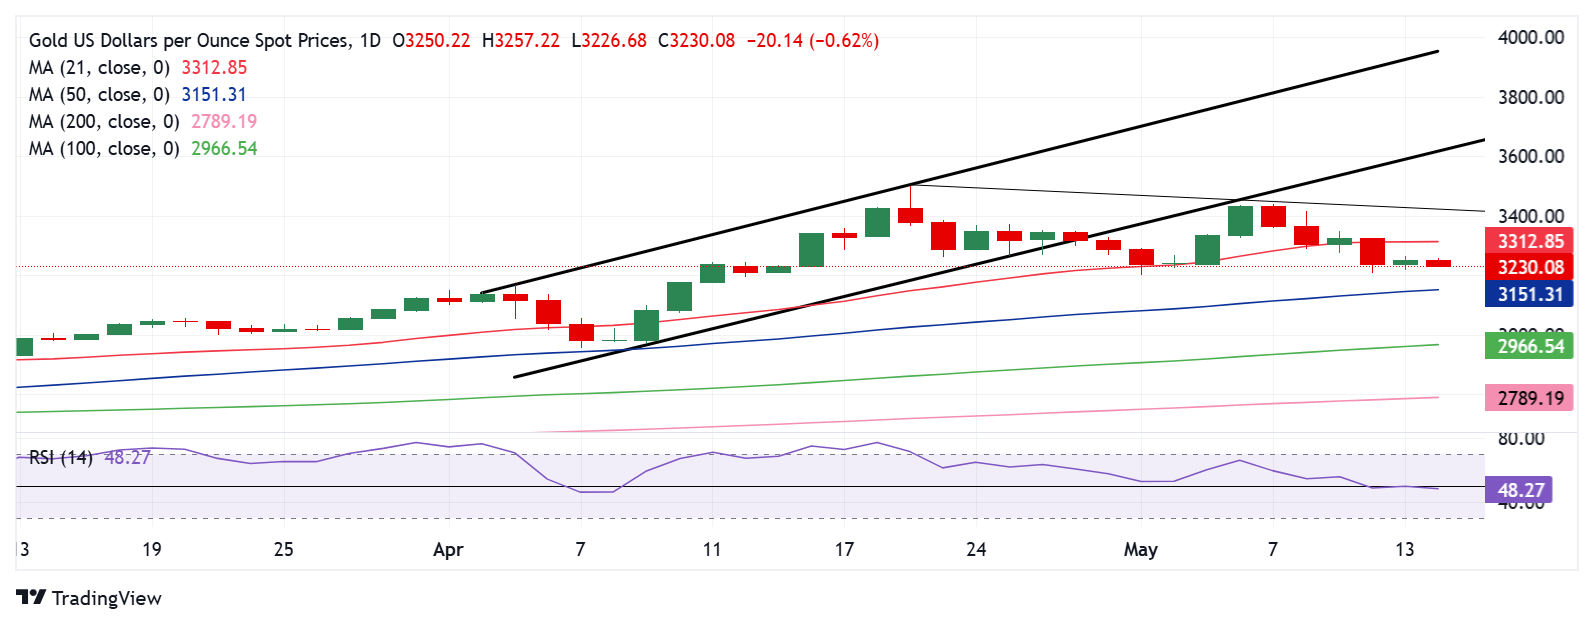
Technically, Gold price remains exposed to further downside risks so long as the price stays below the 21-day Simple Moving Average (SMA) at $3,313.
Adding to it, the 14-day Relative Strength Index (RSI) is currently positioned below the midline, at 48.50, having failed to regain it on a sustained basis on Tuesday.
The next healthy support levels are seen at the $3,100 round level and the April 10 low of $3,072.
On the upside, acceptance above the 21-day SMA at $3,313 will call for a test of the falling trendline resistance at $3,430, where the intermittent resistance aligns.
A fresh upside will then emerge, leading to a retest of the record high of $3,500.
Gold FAQs
Gold has played a key role in human’s history as it has been widely used as a store of value and medium of exchange. Currently, apart from its shine and usage for jewelry, the precious metal is widely seen as a safe-haven asset, meaning that it is considered a good investment during turbulent times. Gold is also widely seen as a hedge against inflation and against depreciating currencies as it doesn’t rely on any specific issuer or government.
Central banks are the biggest Gold holders. In their aim to support their currencies in turbulent times, central banks tend to diversify their reserves and buy Gold to improve the perceived strength of the economy and the currency. High Gold reserves can be a source of trust for a country’s solvency. Central banks added 1,136 tonnes of Gold worth around $70 billion to their reserves in 2022, according to data from the World Gold Council. This is the highest yearly purchase since records began. Central banks from emerging economies such as China, India and Turkey are quickly increasing their Gold reserves.
Gold has an inverse correlation with the US Dollar and US Treasuries, which are both major reserve and safe-haven assets. When the Dollar depreciates, Gold tends to rise, enabling investors and central banks to diversify their assets in turbulent times. Gold is also inversely correlated with risk assets. A rally in the stock market tends to weaken Gold price, while sell-offs in riskier markets tend to favor the precious metal.
The price can move due to a wide range of factors. Geopolitical instability or fears of a deep recession can quickly make Gold price escalate due to its safe-haven status. As a yield-less asset, Gold tends to rise with lower interest rates, while higher cost of money usually weighs down on the yellow metal. Still, most moves depend on how the US Dollar (USD) behaves as the asset is priced in dollars (XAU/USD). A strong Dollar tends to keep the price of Gold controlled, whereas a weaker Dollar is likely to push Gold prices up.
Author

Dhwani Mehta
FXStreet
Residing in Mumbai (India), Dhwani is a Senior Analyst and Manager of the Asian session at FXStreet. She has over 10 years of experience in analyzing and covering the global financial markets, with specialization in Forex and commodities markets.

















