Gold Price Forecast: XAU/USD retains gains above $2,500, higher highs at sight

XAU/USD Current price: $2,515.31
- Upteat United States macroeconomic encouraged near-term US Dollar buying.
- The US will release the Federal Reserve’s favorite inflation gauge at the end of the week.
- XAU/USD could correct lower in the near term, although fresh record highs are still on the table.
Spot Gold retains its bullish bias at the beginning of the week, extending Friday’s gains towards the record high posted last week at $2,531.60. The US Dollar trades mixed across the FX board but was overall weak after Federal Reserve (Fed) Chairman Jerome Powell said that the time has come for monetary policy to adjust, speaking at the Jackson Hole Symposium. Once again, Powell conditioned an interest rate cut to incoming data, but market participants are confident the Fed will deliver a rate cut in the upcoming September meeting.
Other than that, the United States (US) released Durable Goods Orders on Monday, which unexpectedly rose by 9.9% in July, much better than the previous 6.9% or the 4% anticipated. Also, the Dallas Fed Manufacturing Index improved in August to -9.7 from the previous -17.5.
In the meantime, action across financial boards remains limited ahead of critical US data. The country will release next Friday the July Personal Consumption Expenditures (PCE) Price Index, the Fed’s favorite inflation gauge. At the time being, the annual increase is foreseen at 2.5%, matching the June reading, while monthly inflation is expected at 0.2%, slighly higher than the previous 0.1%.
XAU/USD short-term technical outlook
The daily chart for XAU/USD shows the bright metal hovers around Friday’s high and aims to extend gains. Technical indicators have partially lost their upward strength but hold well above their midlines, far from suggesting bullish exhaustion. At the same time, Gold stands above all its moving averages, with the 20 Simple Moving Average (SMA) heading firmly north at around $2,458.75.
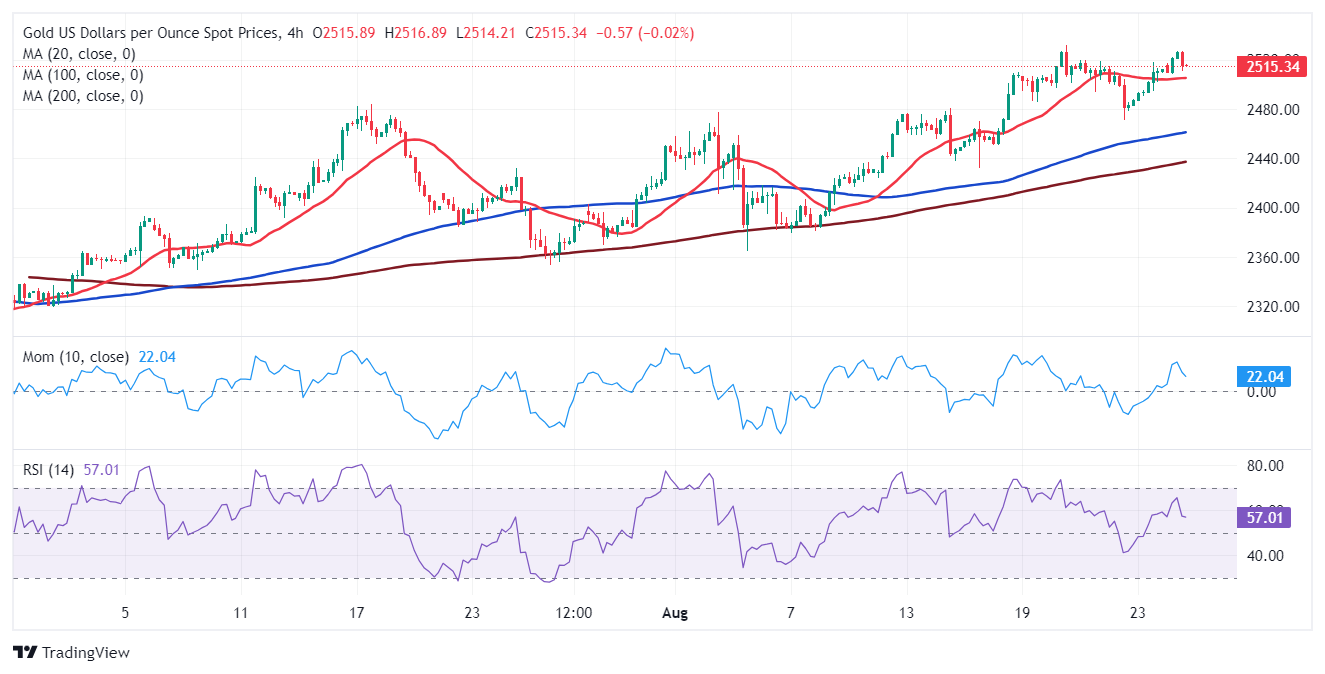
For the near term, technical readings in the 4-hour chart suggest a corrective decline may develop in the next few sessions. Technical indicators have retreated from their recent lows and head firmly lower, although within positive levels. At the same time, the 20 SMA remains directionless, just below the intraday low, while the 100 and 200 SMAs maintain their bullish slopes below the shorter one, limiting the case for a steeper decline.
Support levels: 2,508.80 2,496.40 2,485.10
Resistance levels: 2,523.50 2,531.60 2,542.00
Premium
You have reached your limit of 3 free articles for this month.
Start your subscription and get access to all our original articles.
Author

Valeria Bednarik
FXStreet
Valeria Bednarik was born and lives in Buenos Aires, Argentina. Her passion for math and numbers pushed her into studying economics in her younger years.


