Gold Price Forecast: XAU/USD record rally extends beyond $2,900

XAU/USD Current price: $2,902.98
- US President Donald Trump gears up for another round of tariffs.
- Federal Reserve Chairman Powell's testimony and US inflation coming up next.
- XAU/USD may correct gains in the near term, but market players seek higher highs.
Risk aversion keeps fueling Gold demand, with the bright metal conquering the $2,900 threshold on Monday. Demand for safety was boosted by comments from United States (US) President Donald Trump, who pledged to impose more tariffs over the weekend.
Speaking to reporters on Air Force One, President Trump said on Sunday he would introduce new 25% tariffs on all steel and aluminium imports into the US while adding that he would soon announce reciprocal tariffs to all countries that levy US goods and services. XAU/USD extended gains towards $2,911.21 during American trading hours, hovering nearby at the time of writing.
Demand for safe-haven assets persists despite the positive tone of equities. The US Dollar (USD) trades with a firmer tone against its high-yielding rivals, while demand for Gold and the Japanese Yen (JPY) exceeds that of the Greenback. Meanwhile, Wall Street holds on to modest intraday gains, although caution prevails as investors await fresh Trump’s headlines.
The focus this week will remain on the US. Federal Reserve (Fed) Chairman Jerome Powell will testify before Congress on Tuesday and Wednesday, with market players looking for fresh clues on the future of monetary policy. Additionally, the US will publish the January Consumer Price Index (CPI) on Wednesday, with the core annual reading foreseen at 3.1%, easing from the 3.2% posted in December.
XAU/USD short-term technical outlook
From a technical point of view, XAU/USD is poised to extend its rally. The daily chart shows it retreated from its fresh peak and trades around the $2,900 mark. Technical indicators maintain their upward slopes well into overbought territory without signs of upward exhaustion. Furthermore, the 20 Simple Moving Average (SMA) accelerated north well above bullish 100 and 200 SMAs while developing roughly $140.00 below the current level. A corrective decline is not out of the picture, yet higher highs lay ahead.
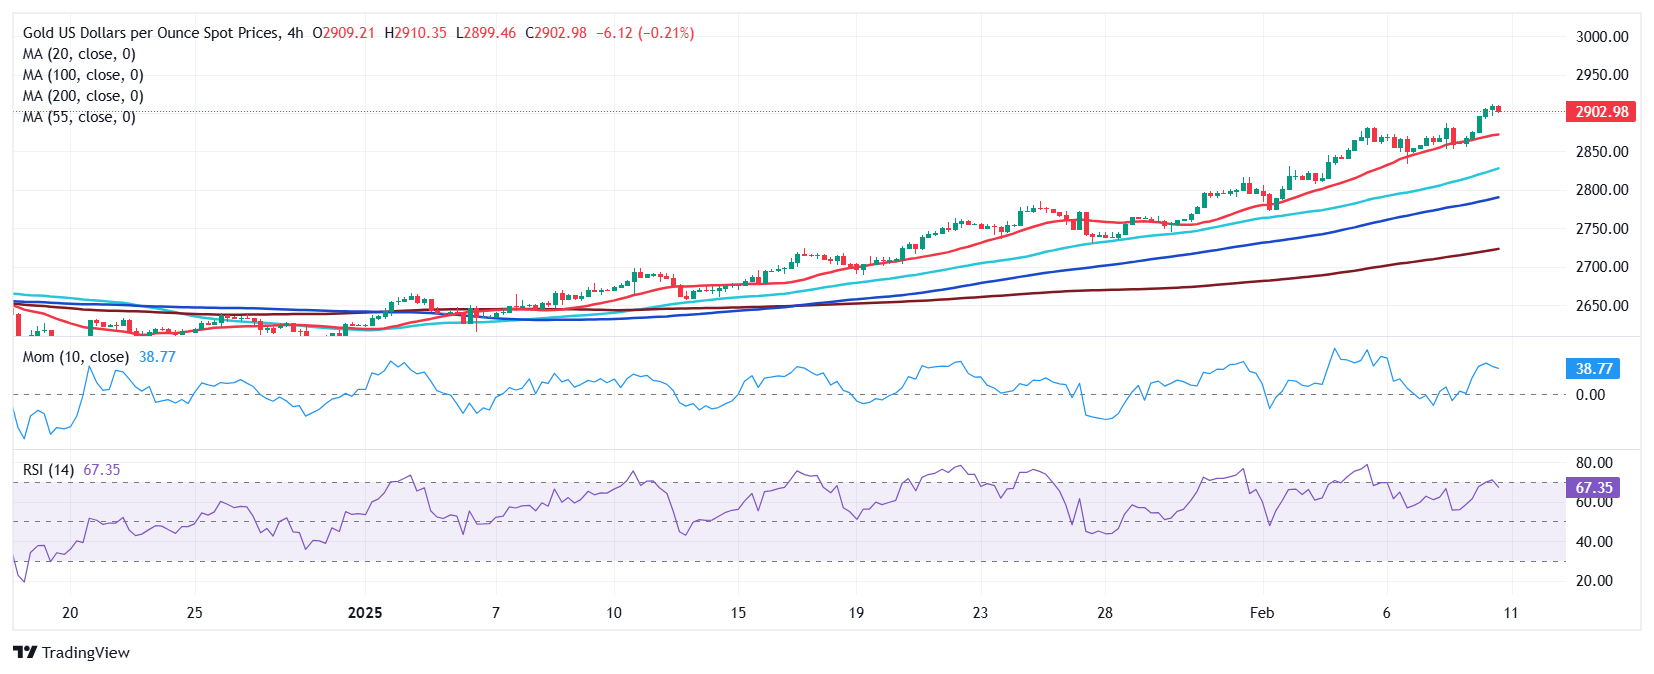
In the near term, and according to the 4-hour chart, XAU/USD is bullish, although a corrective decline is not out of the picture. The Momentum indicator heads firmly north, well above its 100 line, while the Relative Strength Index (RSI) indicator consolidates at around 73. Moving averages, in the meantime, head firmly north, far below the current level, with a bullish 20 Simple Moving Average (SMA) providing intraday support at $2,870.10.
Support levels: 2,886.60 2,872.30 2,855.45
Resistance levels: 2,911.60 2,925.00 2,940.00
Author

Valeria Bednarik
FXStreet
Valeria Bednarik was born and lives in Buenos Aires, Argentina. Her passion for math and numbers pushed her into studying economics in her younger years.


