Gold Price Forecast: XAU/USD ranges around $2,650, awaits fresh clues

XAU/USD Current price: $2,646.55
- The macroeconomic calendar features the United States Consumer Price Index.
- Escalating Middle East tensions undermine the market’s mood at the beginning of the week.
- XAU/USD holds on to familiar levels, but buyers are far from giving up.
Spot Gold's consolidative phase continued throughout the first half of Monday after the noisy United States (US) Nonfarm Payrolls (NFP) report released last Friday. XAU/USD found near-term demand at the beginning of the week as Middle East tensions undermined the market’s mood. Nevertheless, the bright metal turned south early in the American session, as the US Dollar benefits from solid US data supporting the case for a slow pace of interest rate cuts.
The Federal Reserve (Fed) kick-started its monetary loosening cycle with a 50 basis points (bps) interest rate cut in September, prompting bets of similar moves coming in the near term. However, stronger-than-anticipated employment-related data cooled such concerns. The US Dollar recovered its poise and lost its bearish way, as investors no longer fear a recession, not even a soft landing in the foreseeable future.
The macroeconomic calendar had nothing relevant to offer at the beginning of the week, but it will feature the US Consumer Price Index (CPI) and the Federal Open Market Committee (FOMC) Meeting Minutes. Inflation has cooled enough to push the Fed into monetary loosening, and unless the figures bring an unexpected surprise, the US central bank is expected to keep tightening at a slow yet constant pace. As for FOMC Minutes, the document will likely have a limited impact on financial markets, as all has been said and done in the September Fed’s announcement and the Summary of Economic Projections (SEP) released alongside.
XAU/USD short-term technical outlook
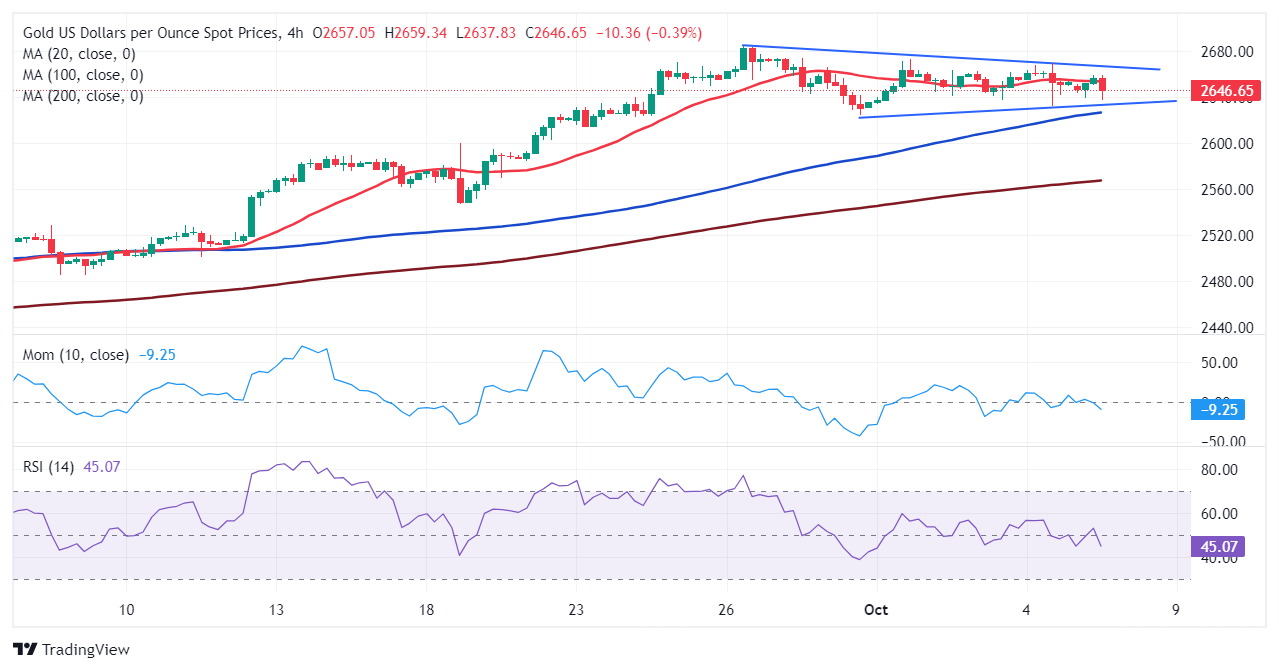
The daily chart for XAU/USD shows the pair is pressuring the base of a near-term wedge but holding within the figure. The pair is also developing above all its moving averages, with the 20 Simple Moving Average (SMA) heading firmly north at around $2,616. The 100 and 200 SMAs maintain their bullish slopes, yet roughly $200 below the shorter one. Finally, the Momentum indicator turned flat within positive levels, while the Relative Strength Index (RSI) indicator aims lower at around 63, correcting overbought conditions and far from supporting another leg south.
The near-term picture is neutral-to-bearish, although a slide below the $2,638 region is required to confirm a continued slide. A mildly bearish 20 SMA provides intraday resistance at around $2,652, while technical indicators develop within negative levels, although lacking clear directional strength. On a positive note, the 100 and 200 SMAs maintain their upward slopes below the current level, suggesting buyers have paused but not yet given up.
Support levels: 2,638.10 2,624.50 2,616.00
Resistance levels: 2,652.10 2,663.00 2,673.20
Premium
You have reached your limit of 3 free articles for this month.
Start your subscription and get access to all our original articles.
Author

Valeria Bednarik
FXStreet
Valeria Bednarik was born and lives in Buenos Aires, Argentina. Her passion for math and numbers pushed her into studying economics in her younger years.


