Gold Price Forecast: XAU/USD potential strategies in turbulent markets
- XAU/USD trading had been eerily quiet amid the market turbulence.
- The daily chart is useful in assessing new directions.
- Yields continue playing a critical role in shaping gold's price.

Where next for gold? Here are two opinions.
* Note that this content originally appeared in response to Premium user's question. Sign up to stay up to speed.
Gold follows its consolidation process of dubious future development
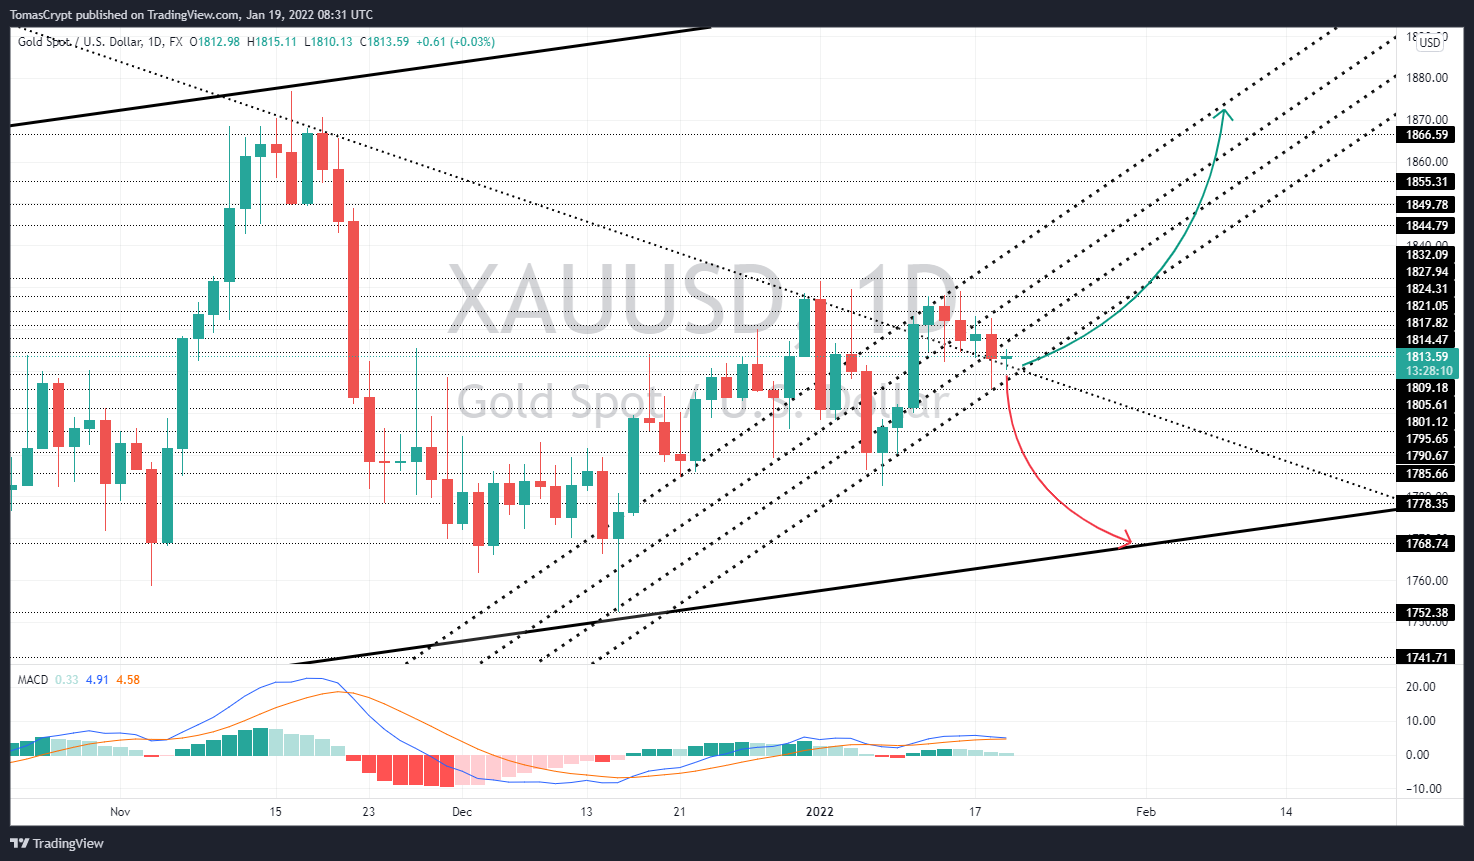
The daily range chart on the XAU/USD pair shows a threateningly bearish profile, but at the moment, it is only a severe threat.
The XAU/USD pair trades at the 1,812.93 price level, holding above the downtrend line originating from the relative highs at 1,876.95. As long as the price remains above the line at the daily close, the bullish breakout should be considered valid and the upward move as the most probable development.
The daily range chart's moving average convergence divergence indicator (MACD) shows a flattened profile with the exponential moving averages close together. This setup informs us of uncertainty about the future direction of the price. The current structure allows for both a bearish crossover and a bullish bounce. In higher time frames, the moving averages show weak bullish setups, so we believe that if the price develops upwards, it will not do so with intensity in the short term.
The current consolidative scenario will remain active as long as the price remains above the 1,810.00 price level at the close. Below this support level, the scenario would turn bearish, with a potential target in the 1,770.00 price range. On the bullish side, a close above the 1,817.82 price level would signal for a new bullish leg with a potential target in the 1,900.00 price range.
The current situation of the XAU/USD pair does not allow us to define a clear future direction. We believe that the strategy should be reactive to the price movement, as declared price levels are pierced or surpassed.
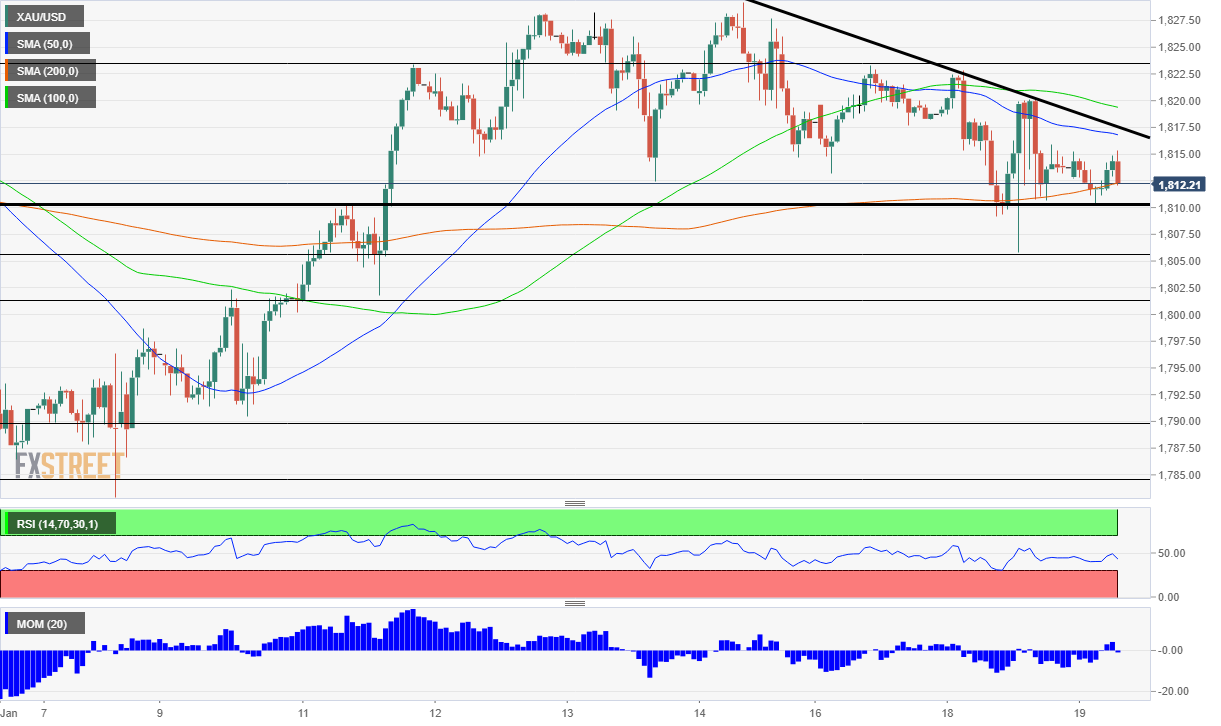
Bearish gold strategy: taking advantage of the descending triangle and higher yields to sell a break below $1,810
The precious metal is trading in a narrow range between $1,812 to $1,816, but zooming out reveals a descending trinagle pattern. XAU/USD has been setting lower highs since late last week – a downtrend resistance line – and roughly above $1,810. Despite several dips below $1,810, gold is generally holding above that line. It also capped gold early last week.
The textbook suggest a descending triangle should result in a breakdown. This technical pattern is also backed by fundamentals – returns on US bonds are rising, making yieldless gold less attractive. Investors are awaiting the Fed decision, which comes only in one week.
The strategy would be to sell XAU/USD next time it makes a substantial dip under $1,810, with the first target being $1,805, the swing low. Further down, the next target is $1,801. With enough momentum, there is room for tumbling down all the way to $1,790.
The recent high of $1,816 would work as a potential area to place a stop-loss point.
Premium
You have reached your limit of 3 free articles for this month.
Start your subscription and get access to all our original articles.
Author
FXStreet Team
FXStreet
Composed of a group of economic journalists and FX experts, the FXStreet content team produces and oversees all content published on FXStreet. It provides a purely journalistic approach to the Forex market.


