XAU/USD Current price: $3,010.80
- Markets kick-started the week with optimism about upcoming Trump’s tariffs.
- Major economies will post inflation updates in the upcoming days.
- XAU/USD nears the $3,000 threshold and may pierce it in the upcoming sessions.

The US Dollar (USD) surged after Wall Street’s opening, resulting in XAU/USD sliding to $3,005.87. As the American session unfolds, the USD retains its broad near-term strength, resulting in the bright metal trading barely above the aforementioned intraday low.
Optimism leads the way on Monday, with stock markets hesitating throughout the first half of the day, but Wall Street soaring. The three major United States (US) indexes are up over 1.5% each at the time of writing, amid hopes President Donald Trump's pre-announced tariffs for April 2nd would be more targeted than previously threatened. The tech sector is among the best performers after the setback suffered in the last few weeks. Government bond yields are down as investors drop safety and seek high-yielding assets.
According to the latest headlines on the matter, Trump will be announcing tariffs on autos, aluminium and pharmaceuticals in the “very near” future.
Meanwhile, US data was mostly encouraging. S&P Global published the preliminary estimates of the March Purchasing Managers’ Indexes (PMIs). The official report states that US business activity growth picked up momentum in March “ as a marked upturn in the service sector offset a renewed fall in manufacturing output.” The Composite PMI improved to 53.5 from 51.6 in February.
There will not be relevant US macroeconomic data on Tuesday, although inflation will be under the spotlight. Several major economies will post updates on price pressures, while the US is meant to release the February Personal Consumption Expenditures (PCE) Price Index figures on Friday.
XAU/USD short-term technical outlook
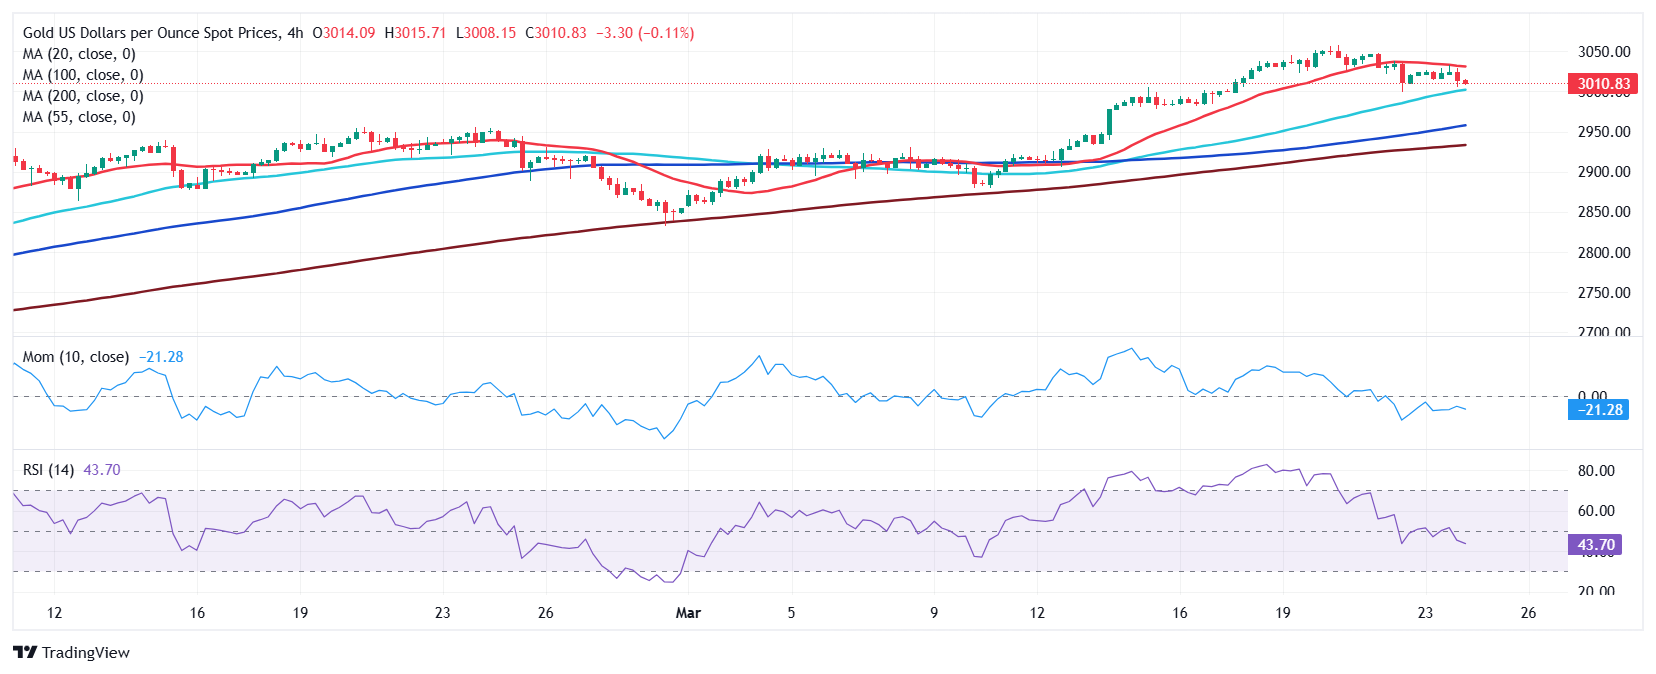
The daily chart for XAU/USD shows its under pressure for a third consecutive day, although the decline still seems corrective. The pair keeps developing above all its moving averages, with a bullish 20 Simple Moving Average (SMA) providing dynamic support at around $2,949.20. The 100 and 200 SMAs, in the meantime, keep heading north far below the shorter one. Finally, technical indicators continue to retreat from extreme levels, heading lower, although well above their midlines.
The near-term picture is bearish. In the 4-hour chart, a mildly bearish 20 SMA at around 3,030. At the same time, technical indicators gain downward momentum within negative levels, in line with another leg south. Still, the 100 and 200 SMAs maintain their bullish slopes over $60 below the current level, limiting the odds for a steeper decline.
Support levels: 2,999.30 2,984.70 2,971.10
Resistance levels: 3,016.25 3,030.50 3,047.40
Information on these pages contains forward-looking statements that involve risks and uncertainties. Markets and instruments profiled on this page are for informational purposes only and should not in any way come across as a recommendation to buy or sell in these assets. You should do your own thorough research before making any investment decisions. FXStreet does not in any way guarantee that this information is free from mistakes, errors, or material misstatements. It also does not guarantee that this information is of a timely nature. Investing in Open Markets involves a great deal of risk, including the loss of all or a portion of your investment, as well as emotional distress. All risks, losses and costs associated with investing, including total loss of principal, are your responsibility. The views and opinions expressed in this article are those of the authors and do not necessarily reflect the official policy or position of FXStreet nor its advertisers. The author will not be held responsible for information that is found at the end of links posted on this page.
If not otherwise explicitly mentioned in the body of the article, at the time of writing, the author has no position in any stock mentioned in this article and no business relationship with any company mentioned. The author has not received compensation for writing this article, other than from FXStreet.
FXStreet and the author do not provide personalized recommendations. The author makes no representations as to the accuracy, completeness, or suitability of this information. FXStreet and the author will not be liable for any errors, omissions or any losses, injuries or damages arising from this information and its display or use. Errors and omissions excepted.
The author and FXStreet are not registered investment advisors and nothing in this article is intended to be investment advice.
Recommended Content
Editors’ Picks

EUR/USD bounces off lows, retests 1.1370
Following an early drop to the vicinity of 1.1310, EUR/USD now manages to regain pace and retargets the 1.1370-1.1380 band on the back of a tepid knee-jerk in the US Dollar, always amid growing optimism over a potential de-escalation in the US-China trade war.

GBP/USD trades slightly on the defensive in the low-1.3300s
GBP/USD remains under a mild selling pressure just above 1.3300 on Friday, despite firmer-than-expected UK Retail Sales. The pair is weighed down by a renewed buying interest in the Greenback, bolstered by fresh headlines suggesting a softening in the rhetoric surrounding the US-China trade conflict.

Gold remains offered below $3,300
Gold reversed Thursday’s rebound and slipped toward the $3,260 area per troy ounce at the end of the week in response to further improvement in the market sentiment, which was in turn underpinned by hopes of positive developments around the US-China trade crisis.

Ethereum: Accumulation addresses grab 1.11 million ETH as bullish momentum rises
Ethereum saw a 1% decline on Friday as sellers dominated exchange activity in the past 24 hours. Despite the recent selling, increased inflows into accumulation addresses and declining net taker volume show a gradual return of bullish momentum.

Week ahead: US GDP, inflation and jobs in focus amid tariff mess – BoJ meets
Barrage of US data to shed light on US economy as tariff war heats up. GDP, PCE inflation and nonfarm payrolls reports to headline the week. Bank of Japan to hold rates but may downgrade growth outlook. Eurozone and Australian CPI also on the agenda, Canadians go to the polls.

The Best brokers to trade EUR/USD
SPONSORED Discover the top brokers for trading EUR/USD in 2025. Our list features brokers with competitive spreads, fast execution, and powerful platforms. Whether you're a beginner or an expert, find the right partner to navigate the dynamic Forex market.