Gold Price Forecast: XAU/USD menaces a bearish breakout of the $2,000 mark

XAU/USD Current price: 2,004.64
- Resilient United States data and comments from Fed officials undermine the market mood.
- Stocks trade in the red for a second consecutive day, yields reach fresh multi-week highs.
- XAU/USD bearish momentum supports a slide below the $2,000 mark in the near term.
Spot gold trades at its lowest since mid-December, as the US Dollar extends its advance as global stocks fell further. The XAU/USD pair trades near an intraday low of $2,003.28 mid US-afternoon, as investors keep reducing bets on a Federal Reserve (Fed) rate cut next March. The CME FedWatch Tool shows a 52% chance of such an event, down from roughly 70% a couple of weeks ago.
Mixed United States (US) data released on Wednesday further weighed on the pair. The country reported that Retail Sales were up 0.6% MoM in December, while Industrial Production in the same month increased 0.1%, both beating expectations. Capacity Utilization rose 78.6%, below the 78.7% expected. Resilient macroeconomic data combined with hawkish words from Fed officials weighing down the odds for a March cut.
Government bond yields are also on the rise, with the more sensitive 2-year Treasury note currently offering 4.36%, while the 10-year note yields 4.10%, both standing at fresh multi-week highs. Wall Street, on the other hand, extends its Tuesday slump with the three major indexes trading in the red.
XAU/USD short-term technical outlook
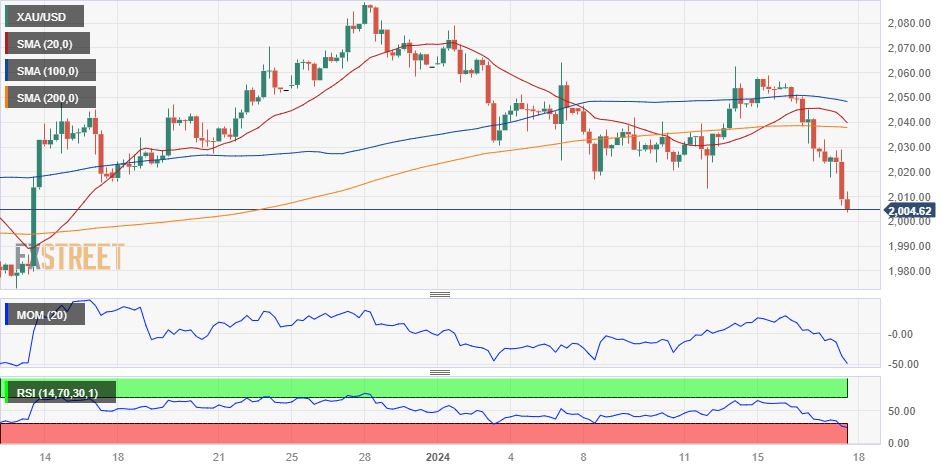
XAU/USD is down for a second consecutive session, and the daily chart shows additional declines are on the table. The pair extends its slide below a mildly bearish 20 Simple Moving Average (SMA) but holds above the 100 and 200 SMAs, both in the $1,960 region. Technical indicators, in the meantime, head sharply south within negative levels without signs of bearish exhaustion.
The bearish momentum is stronger in the near term. The 4-hour chart shows XAU/USD develops below all its moving averages, slowly gaining downward traction. The 200 SMA provides dynamic resistance at around $2,037.25. Finally, technical indicators maintain the downward pressure near oversold readings, supporting a bearish breakout of the $2,000 threshold.
Support levels: 2,049.15 2,037.90 2,024.50
Resistance levels: 2,062.35 2,074.40 2,087.00
Premium
You have reached your limit of 3 free articles for this month.
Start your subscription and get access to all our original articles.
Author

Valeria Bednarik
FXStreet
Valeria Bednarik was born and lives in Buenos Aires, Argentina. Her passion for math and numbers pushed her into studying economics in her younger years.


