Gold Price Forecast: XAU/USD maintains the upward pressure, aims for higher highs

XAU/USD Current price: $4,343.02
- Trade tensions between the US and China underpin demand for the bright metal.
- United States Consumer Price Index to be released next Friday despite the shutdown.
- XAU/USD loses near-term momentum, but buyers hold the grip.
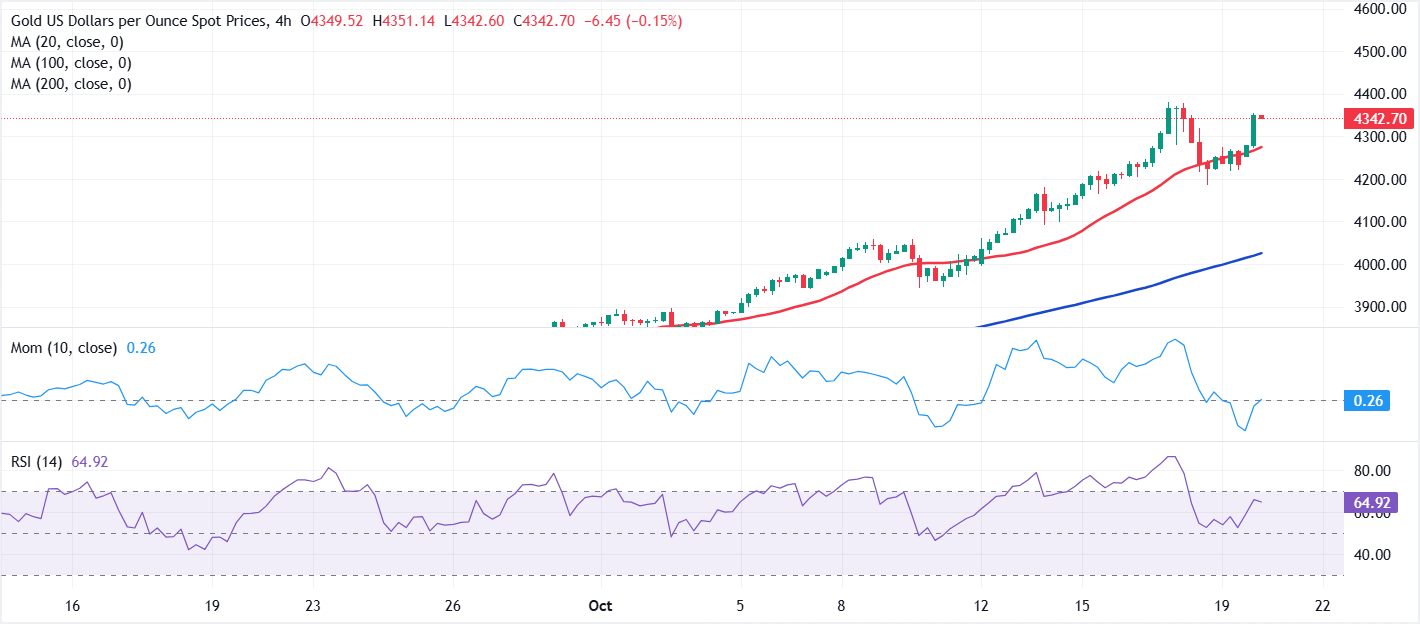
Spot Gold trades near its all-time high of $4,379.76 a troy ounce, up on a daily basis on Monday. The positive tone of global equities limits XAU/USD's near-term bullish potential, but underlying political and trade woes keep the bright metal afloat.
Market participants are keeping an eye on the United States (US) - China trade relationship. US President Donald Trump demanded that Beijing buy additional soybeans and take action on fentanyl to take back the threat of additional levies. Beijing, however, seems less worried.
According to data released at the beginning of the day, the Chinese Gross Domestic Product (GDP) rose 1.1% in the three months to September, beating the market’s expectations of 0.8%. The annualized figure posted a healthy 4.8%, as expected. Other than that, the country reported that Retail Sales in the year to September were up 3%, while Industrial Production in the same period increased 6.5%, both beating expectations of 2.9% and 5% respectively.
The figures suggest China has little to worried about what the US may or may not do, as the economy is doing well regardless of the White House actions and threats.
Meanwhile, the macroeconomic calendar has little to offer these days, although the United Kingdom (UK), Canada, and the US will release fresh Consumer Price Index (CPI) data. The US CPI will be released regardless of the government shutdown on Friday, according to the Bureau of Labor Statistics (BLS).
XAU/USD short-term technical outlook
The XAU/USD pair is hovering around $4,350, and the daily chart shows bulls are in full control of the metal. In the mentioned time frame, technical indicators resumed their advances within overbought territory after correcting extreme readings. At the same time, the pair is far above all bullish moving averages, with the $3,0 SMA currently at around $3,983.
In the near term, the risk skews to the upside, although the momentum faded. Technical indicators stand far above their midlines, but lack directional strength. Meanwhile, intraday slides below a bullish 20 SMA were quickly reversed, with the pair currently well above the indicator. The 20 SMA provides support in the $4,278 price zone.
Support levels: 4,323.80 4,311.40 4,300.00
Resistance levels: 4,355.60 4,367.10 4,379.80
Author

Valeria Bednarik
FXStreet
Valeria Bednarik was born and lives in Buenos Aires, Argentina. Her passion for math and numbers pushed her into studying economics in her younger years.

















