Gold Price Forecast: XAU/USD losing impetus around $1,920

XAU/USD Current price: $1,919.53
- Mixed United States macroeconomic figures undermined the market mood.
- Federal Reserve officials suggest the central bank has done enough with monetary policy.
- XAU/USD losing bullish potential but holding on to modest intraday gains.
Spot Gold extended its weekly rally to $1,923.34 a troy ounce, holding on to modest intraday gains just below it mid-American session. The US Dollar remained under selling pressure throughout the first half of the day, as government bond yields continued to ease while stock markets traded in the green.
The USD found temporal demand following the release of mixed United States (US) data, as Durable Goods Orders fell 5.2% in July, much worse than anticipated. On the other hand, Initial Jobless Claims for the week ended August 18 improved to 230K, beating the 240K expected, while the July Chicago Fed National Activity Index resulted at 0.12 from -0.33 in the previous month.
Stock markets began retreating following macroeconomic figures, with Wall Street accelerating its slide after the opening, and despite encouraging comments from Federal Reserve (Fed) officials. Boston Federal Reserve President Susan Collins said that they may be at a place where the Fed can hold the policy rate steady in an interview offered on Thursday, while Federal Reserve Bank of Philadelphia President Patrick Harker moved in the same direction. In an interview with CNBC, Harker said he thinks the Fed has “probably done enough” with monetary policy.
The USD strengthens on the back of the ruling dismal mood, also helped by the better tone of Treasury yields, preventing XAU/USD from extending its gains.
XAU/USD price short-term technical outlook
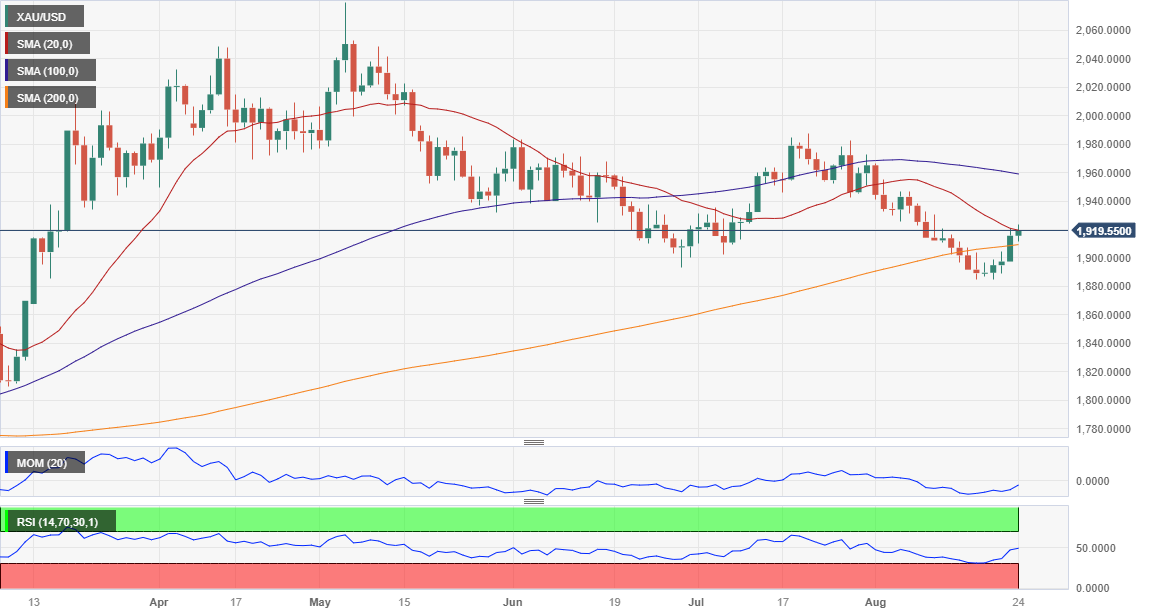
XAU/USD trades in the green for a fourth consecutive day, but the bullish potential seems limited. The pair is meeting sellers around the 38.2% Fibonacci retracement of the $1,982.12/$1,884.77 slide at $1,921.80. The daily chart shows that Gold is battling to overcome a bearish 20 Simple Moving Average (SMA), which remains far below the 100 SMA. The 200 SMA, in the meantime, converges with the 23.6% retracement at 1,907.30, reinforcing the support level. Finally, technical indicators have turned flat right below their midlines, reflecting decreased buying interest.
For the near term, and according to the 4-hour chart, XAU/USD is also losing bullish strength. Still, the pair keeps developing above its 20 and 100 SMAs, with the shorter one gaining upward traction. Technical indicators, on the contrary, have retreated from their recent highs and head south with uneven strength within positive levels.
Support levels: 1,907.30 1,898.10 1,884.75
Resistance levels: 1,921.80 1,933.30 1,944.85
Premium
You have reached your limit of 3 free articles for this month.
Start your subscription and get access to all our original articles.
Author

Valeria Bednarik
FXStreet
Valeria Bednarik was born and lives in Buenos Aires, Argentina. Her passion for math and numbers pushed her into studying economics in her younger years.


