Gold Price Forecast: XAU/USD looks south amid Bear Flag, ahead of key United States data
- Gold price is set for the second weekly drop, as hawkish Federal Reserve bets weigh.
- Focus shifts to Friday’s United States Consumer Sentiment and next week’s CPI data.
- Gold price charts a Bear Flag on the 1D, putting the 50-Daily Moving Average at risk.

Gold price is sitting at the lowest level in five weeks near the $1,850 psychological mark on the final trading day of the week, on track to book the second weekly drop. The renewed uptick in the United States Dollar (USD) amid souring risk sentiment is exerting further downside pressure on the Gold price.
The additional legs to the US Dollar pullback come this Friday, as markets continue to reprice Federal Reserve rate hike expectations, in the face of the recent hawkish commentary from Fed officials. Higher interest rates for longer weigh on the corporate sector, weighing negatively on global stocks.
Investors also turn cautious ahead of the first relevant economic data from the United States this week. The US Preliminary University of Michigan (UoM) Consumer Sentiment and Inflation Expectations data are on tap, which could offer fresh hints on the Fed’s policy outlook ahead of the next week’s crucial US Consumer Price Index (CPI) data.
The end-of-the-week repositioning could also come into play, exacerbating the pain in the Gold price, as investors gear up for next Tuesday’s key United States event release. Fed Governor Christopher Waller is speaking for the second time this week on Friday, having warned on Wednesday of higher interest rates than expectations ahead.
At the time of writing, the US Dollar Index is rising toward 103.50 while the US S&P 500 futures are losing 0.15% on the day. Gold price is testing five-week lows at $1,854, despite sluggish US Treasury bond yields.
Gold price technical analysis: Daily chart
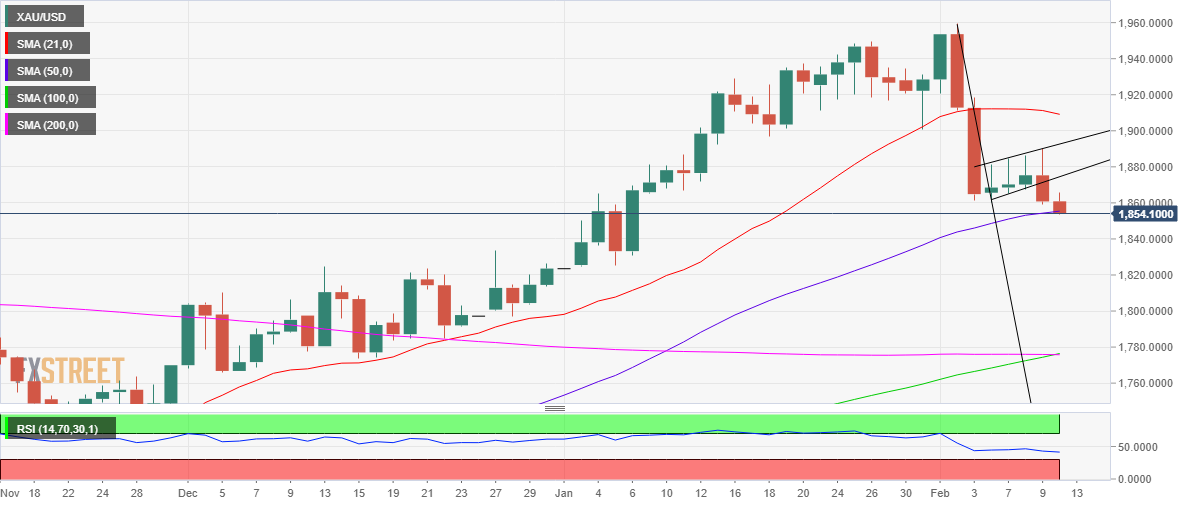
Gold price confirmed a Bear Flag on Thursday after closing the day below the rising trendline support at $1,871.
The bearish continuation pattern has provided extra zest to Gold sellers, as they challenge the critical 50-Daily Moving Average (DMA) at $1,855.
The 14-day Relative Strength Index (RSI) is inching lower below the midline, justifying the renewed weakness in the Gold price.
The downside break has outweighed the optimism on a potential bullish crossover, for now. The 100DMA has crossed the 200DMA for the upside but bulls need validation on a daily closing basis.
Overall, the downisde bias remains favored, with a sustained move toward the January 5 low of $1,825 eyed should the $1,850 support give way.
On the upside, any recovery attempts will need to recapture the bear flag support-turned-resistance at $1,871.
The next stop for Gold optimists is seen at around the $1,885 level, the static resistance.
Author

Dhwani Mehta
FXStreet
Residing in Mumbai (India), Dhwani is a Senior Analyst and Manager of the Asian session at FXStreet. She has over 10 years of experience in analyzing and covering the global financial markets, with specialization in Forex and commodities markets.

















