Gold Price Forecast: XAU/USD in a wait-and-see mode, as geopolitical risks, US CPI data loom
- Gold price consolidates the previous week’s late rebound, as the US CPI week kicks off.
- A sense of caution prevails on pre-US CPI anxiety and geopolitical risks, supporting the US Dollar.
- Dovish Fed bets could limit any Gold price downside while the 21-day SMA holds and the daily RSI stays bullish.

Gold price is trading on the back foot near $2,430 early Monday, consolidating the previous week’s late recovery. Traders appear non-committal and refrain from placing fresh bets on Gold price, bracing for an action-packed week, with US Consumer Price Index (CPI) inflation data in the spotlight.
Gold price braces for Iran-Israel escalation and key US data
Traders take account of the latest developments surrounding the Middle-East geopolitical tensions, with Israel preparing for an imminent attack by Iran, in retaliation for the assassination of Hamas leader Ismail Haniyeh in Tehran in late July. On Sunday, Axios reported that the Israeli intelligence community is put on a high alert, as it is believed that Iran has decided to attack Israel directly and may do so within days.
Meanwhile, ABC News reported early Monday that the Israel Defense Forces (IDF) intercepted roughly 30 "projectiles" that were identified as crossing from Lebanon into northern Israel. This comes even as Hamas proposed a cease-fire implementation plan after a diplomatic push from the United States, Egypt and Qatar for a new round of talks to take place between Israel and Hamas on Aug. 15 in either Doha or Cairo.
If the Iran-backed militant groups, Hezbollah and Hamas, turn down any cease-fire attempts and attack Israel, the escalation could very well translate into a wider regional conflict. Mounting geopolitical tensions are likely to keep the safe-haven US Dollar (USD) buoyed, weighing negatively on the USD-denominated Gold price.
However, the downside in the Gold price could likely be cushioned by the increased bets that the US Federal Reserve (Fed) will lower interest rates by 50 basis points (bps) in September. Although the odds for such a move have fallen to less than 50% when compared to about 75% a week ago, the CME Group’s FedWatch Tool showed.
This could be attributed to Fed Governor Michelle Bowman's caution on rate cuts during her speech on Saturday. Bowman noted that there is some further "welcome" progress on inflation even as inflation remains "uncomfortably above" the central bank's 2% goal.
Markets remain in a wait-and-see mode before taking any calls on the next Gold price direction, as position readjustments could be seen heading into Wednesday’s US CPI showdown. The headline annual CPI is set to rise 2.9% in July after increasing by 3.0% in June. Meanwhile, the core inflation is expected to edge a tad lower to 3.2% YoY in July versus June’s 3.3% print.
Gold price technical analysis: Daily chart
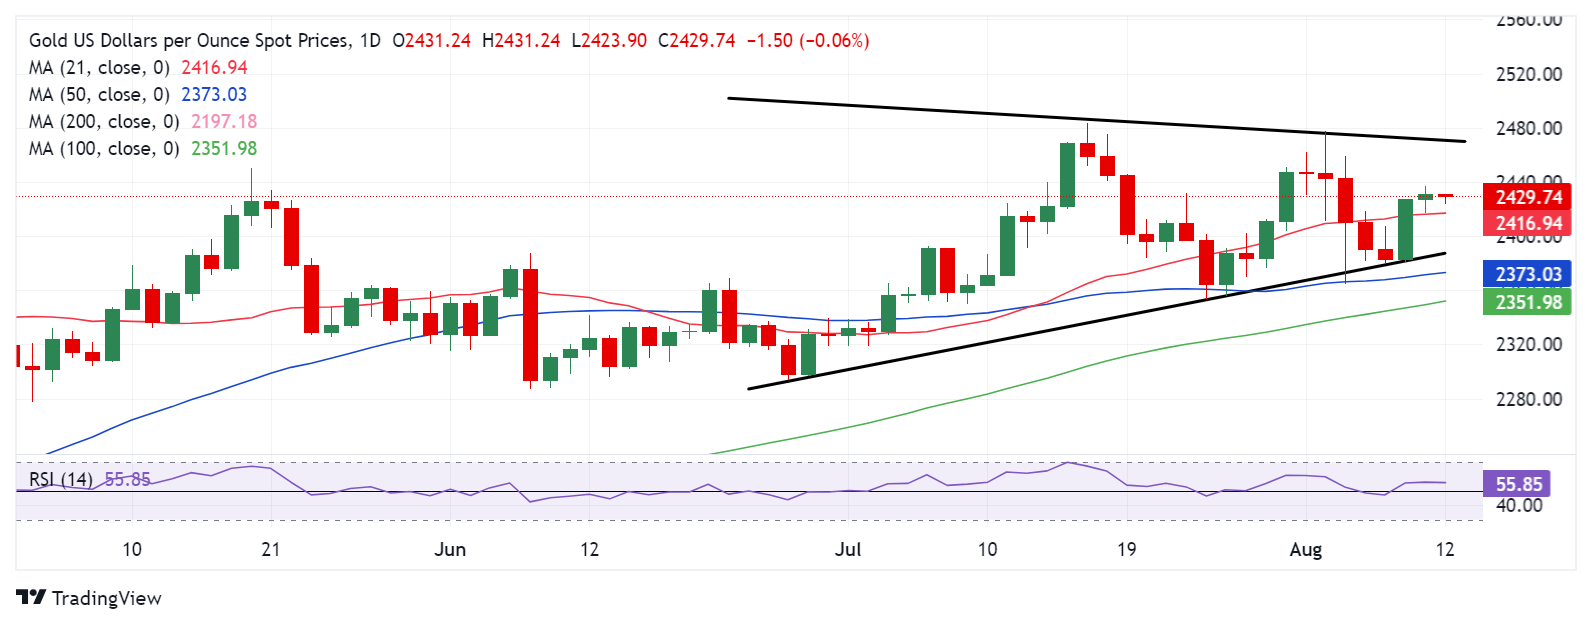
As observed on the daily chart, Gold price keeps its range while holding within a symmetrical triangle formation.
The key leading indicator, the 14-day Relative Strength Index (RSI) holds well above the 50 level, suggesting that upside risks remain in place for Gold price in the near term.
Gold buyers also stay hopeful so long as the 21-day Simple Moving Average (SMA) at $2,417 holds.
However, if the pullback extends, sellers need to crack the 21-day SMA on a daily closing basis to unleash further downside.
Further south, the $2,400 threshold will come into play, below which the rising trendline support at $2,388 will be under threat.
Alternatively, the immediate upside barrier is seen at the August 5 high of $2,459, above which the falling trendline resistance at $2,465 and the two-week high of $2,478 will be challenged.
Gold FAQs
Gold has played a key role in human’s history as it has been widely used as a store of value and medium of exchange. Currently, apart from its shine and usage for jewelry, the precious metal is widely seen as a safe-haven asset, meaning that it is considered a good investment during turbulent times. Gold is also widely seen as a hedge against inflation and against depreciating currencies as it doesn’t rely on any specific issuer or government.
Central banks are the biggest Gold holders. In their aim to support their currencies in turbulent times, central banks tend to diversify their reserves and buy Gold to improve the perceived strength of the economy and the currency. High Gold reserves can be a source of trust for a country’s solvency. Central banks added 1,136 tonnes of Gold worth around $70 billion to their reserves in 2022, according to data from the World Gold Council. This is the highest yearly purchase since records began. Central banks from emerging economies such as China, India and Turkey are quickly increasing their Gold reserves.
Gold has an inverse correlation with the US Dollar and US Treasuries, which are both major reserve and safe-haven assets. When the Dollar depreciates, Gold tends to rise, enabling investors and central banks to diversify their assets in turbulent times. Gold is also inversely correlated with risk assets. A rally in the stock market tends to weaken Gold price, while sell-offs in riskier markets tend to favor the precious metal.
The price can move due to a wide range of factors. Geopolitical instability or fears of a deep recession can quickly make Gold price escalate due to its safe-haven status. As a yield-less asset, Gold tends to rise with lower interest rates, while higher cost of money usually weighs down on the yellow metal. Still, most moves depend on how the US Dollar (USD) behaves as the asset is priced in dollars (XAU/USD). A strong Dollar tends to keep the price of Gold controlled, whereas a weaker Dollar is likely to push Gold prices up.
Premium
You have reached your limit of 3 free articles for this month.
Start your subscription and get access to all our original articles.
Author

Dhwani Mehta
FXStreet
Residing in Mumbai (India), Dhwani is a Senior Analyst and Manager of the Asian session at FXStreet. She has over 10 years of experience in analyzing and covering the global financial markets, with specialization in Forex and commodities markets.


