Gold Price Forecast: XAU/USD holding ground just below $3,400

XAU/USD Current price: $3,390.00
- Global trade tensions and the Middle East crisis underpin the bright metal.
- The looming Federal Reserve announcement is likely to rock the US Dollar.
- XAU/USD extends its consolidative phase ahead of $3,400 with the risk tilt to the upside.
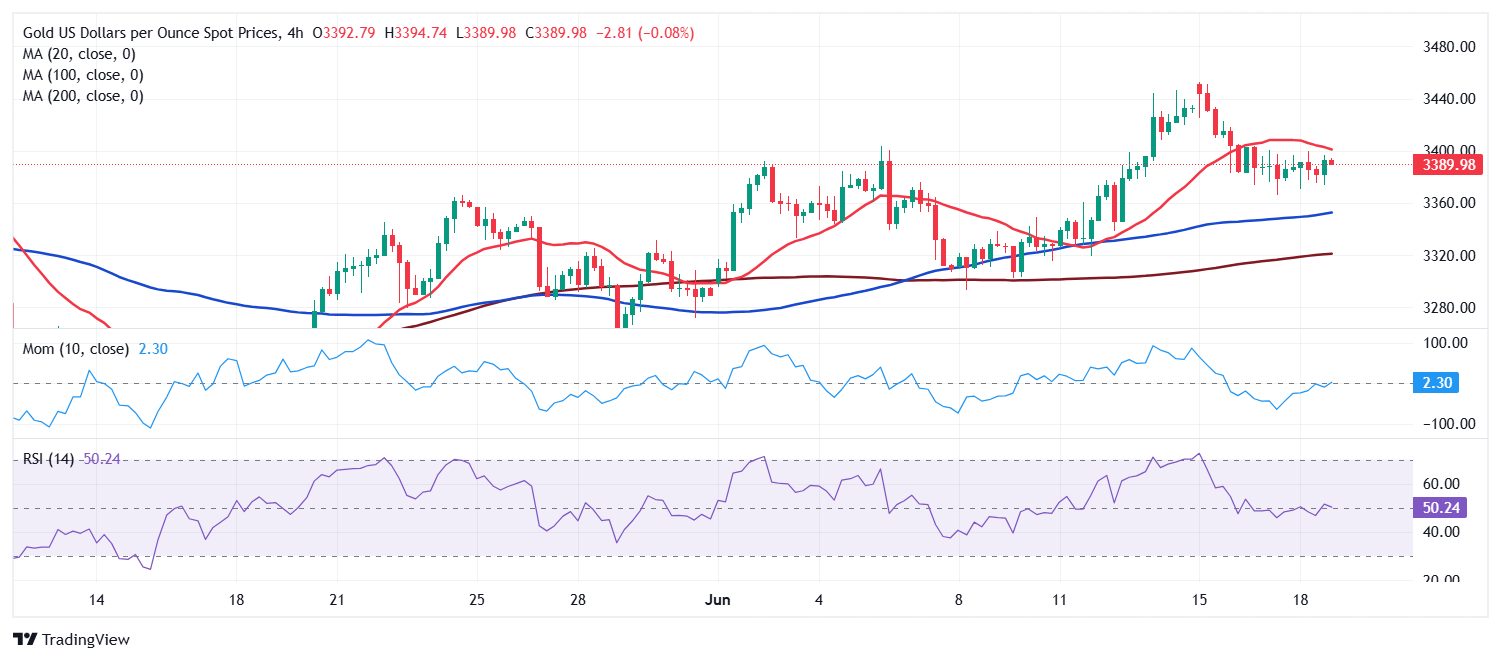
Spot Gold hovers around $3,390 a troy ounce on Wednesday, unable to attract speculative interest ahead of the United States (US) Federal Reserve (Fed) monetary policy announcement.
Still, the bright metal remains afloat amid global tensions. Concerns revolve around trade talks and the Middle East crisis, with no progress at any front. On the one hand, US President Donald Trump “complained” about tough negotiations with the European Union and Japan. On the other hand, tit-for-tat missile attacks between Iran and Israel entered their sixth consecutive day, with no signs of de-escalation.
The Fed is widely anticipated to keep interest rates on hold, with the focus on the Summary of Economic Projections (SEP) and Chairman Jerome Powell's press conference. Policymakers will deliver fresh growth, inflation and employment expectations, alongside their estimate on future interest rate cuts. Currently, the latest SEP indicates that Fed officials are still aiming for two cuts in 2025. Any change in such perspective could have a wild impact on the US Dollar (USD).
XAU/USD short-term technical outlook
The daily chart for the XAU/USD pair shows it failed to attract investors for a second day in a row. Also, technical indicators remain well above their midlines, although without directional strength. Finally, XAU/USD develops above all its moving averages, with the 20 Simple Moving Average (SMA) heading marginally higher at around $3,347.10 while holding far above bullish 100 and 200 SMAs.
The near-term picture is neutral. In the 4-hour chart, technical indicators turned marginally higher yet mixed at around their midlines, unable to confirm a leg north. At the same time, XAU/USD develops below a mildly bearish 20 SMA, while the longer moving averages aim modestly higher, well below the current level.
Support levels: 3,382.85 3,366.10 3,352.40
Resistance levels: 3,406.90 3,414.60 3,437.85
Author

Valeria Bednarik
FXStreet
Valeria Bednarik was born and lives in Buenos Aires, Argentina. Her passion for math and numbers pushed her into studying economics in her younger years.

















