Gold Price Forecast: XAU/USD flirts with $3,400 amid demand for safety

XAU/USD Current price: $3,378.94
- United States involvement in the Middle East crisis fuels demand for Gold.
- S&P Global released upbeat preliminary estimates of the US June PMIs.
- XAU/USD nears $3,400 but loses its near-term bullish momentum.
Spot Gold trades around $3,900, nearing its early peak at $3,397.33 in the mid-American session. The bright metal gapped north at the weekly opening amid the escalation of the Iran-Israel crisis after the involvement of the United States (US). President Donald Trump announced on Saturday that his country successfully destroyed Iranian nuclear facilities in three locations, Fordow, Natanz and Isfahan, pushing investors into safety.
The US Dollar (USD) found some near-term demand during European trading hours, resulting in XAU/USD pulling back sharply towards the $3340 region. Still, the American opening brought another round of risk aversion, amid market talks indicating Iran launched a missile attack on US military bases in Doha, Qatar.
Meanwhile, speculative interest read beyond encouraging US data. S&P Global reported higher-than-anticipated preliminary June Purchasing Managers’ Indexes (PMIs). The manufacturing index posted 52, matching the May reading but above the expected 51. The Services PMI eased from the previous 53.7 to 53.1, which is above the anticipated 52.9. As a result, the Composite PMI printed at 52, slightly above the 51 expected.
Middle East headlines will likely overshadow everything else in the upcoming days, although it is worth mentioning that US Federal Reserve (Fed) Chairman Jerome Powell is due to testify about the Semiannual Monetary Policy Report before Congress on Tuesday. Given the recent developments, there are rising odds that Powell will be asked to explain what the Fed plans to do if tariffs come into effect and the Middle East conflict escalates.
XAU/USD short-term technical outlook
The daily chart for XAU/USD shows it bounced sharply from a directionless 20 Simple Moving Average (SMA), which, anyway, develops far above bullish 100 and 200 SMAs. The shorter moving average currently provides dynamic support at around $3,352.70. Other than that, technical indicators bounced from around their midlines, but lack enough strength to support another leg north.
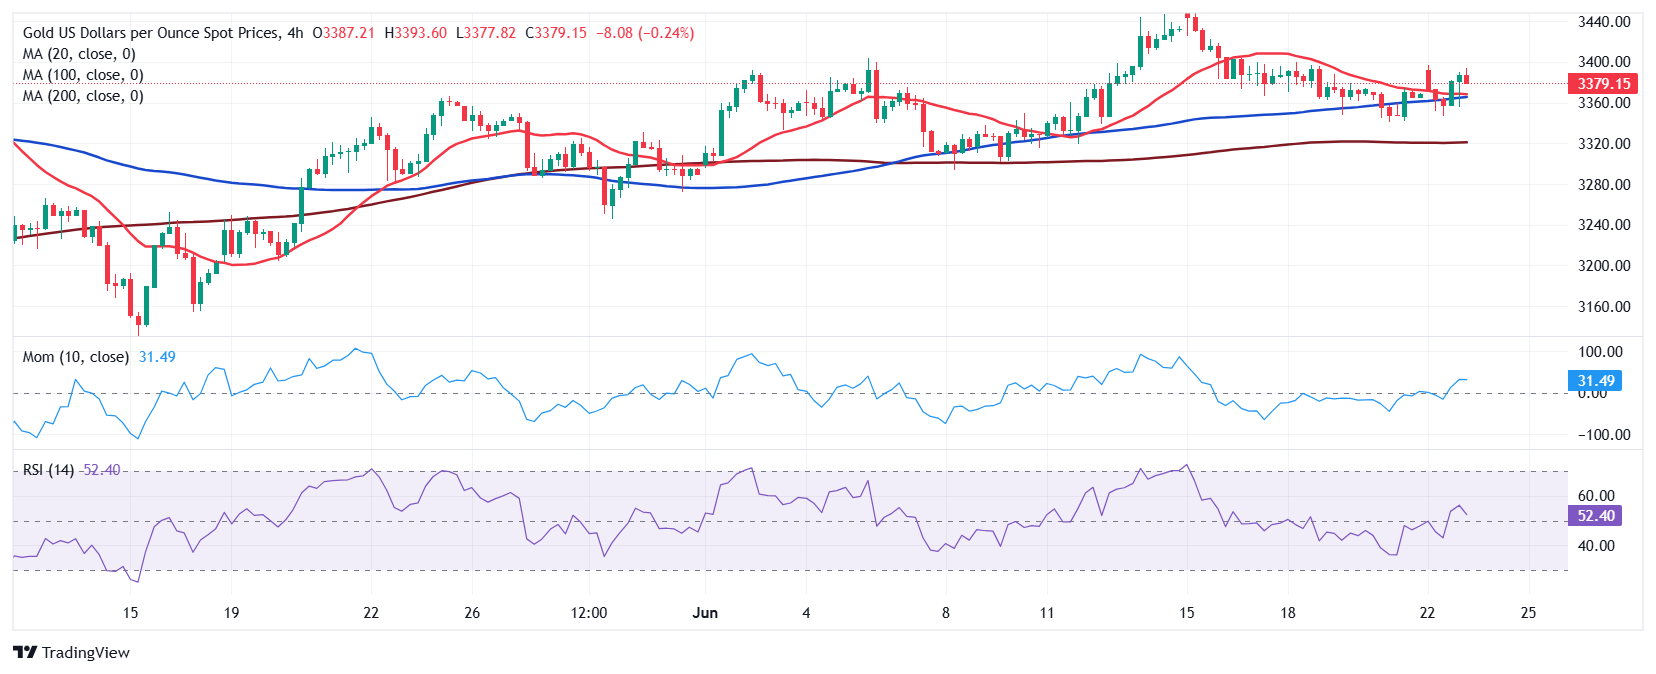
In the near term, and according to the 4-hour chart, XAU/USD is losing its bullish impetus. The pair is developing above all its moving averages, which lack clear directional strength. Technical indicators in the meantime, turned flat after crossing their midlines into positive territory.
Support levels: 3,366.10 3,352.70 3,340.20
Resistance levels: 3,406.90 3,414.60 3,431.10
Premium
You have reached your limit of 3 free articles for this month.
Start your subscription and get access to all our original articles.
Author

Valeria Bednarik
FXStreet
Valeria Bednarik was born and lives in Buenos Aires, Argentina. Her passion for math and numbers pushed her into studying economics in her younger years.


