Gold Price Forecast: XAU/USD fails to sustain gains above $5,000 for third consecutive day

XAU/USD Current price: $4,881
- United States employment-related data came in worse than anticipated.
- The Bureau of Labor Statistics will resume publishing first-tier data next week.
- XAU/USD retains a modest bearish bias in the near-term.
Spot Gold changed direction on Thursday, trimming a good chunk of its recent gains. The XAU/USD pair trades around $4,880 in the American afternoon, after briefly surpassing the $5,000 mark during Asian trading hours. It is the third consecutive day on which the bright metal fails to sustain gains above the critical threshold, a discouraging sign for buyers.
Gold retreats despite Wall Street trading in the red, suggesting increased risk aversion. At the same time, the US Dollar (USD) maintains its positive tone, despite weak United States (US) employment-related data. Initial Jobless Claims for the week ended January 31 unexpectedly rose to 231K, while JOLTS Job Openings stood at 6.542 million on the last business day of December, down from the downwardly revised November figure of 6.928 million.
Following the latest monetary policy meeting, Federal Reserve (Fed) officials noted that “Job gains have remained low, and the unemployment rate has shown some signs of stabilization,” indicating less concern about the sector's situation. The recently released figures are consistent with policymakers’ statements and are expected to have little impact on monetary policy in the near term.
Other than that, the US Bureau of Labor Statistics (BLS) announced that, following the partial government shutdown, it will resume releasing data. The Nonfarm Payrolls (NFP) report and Consumer Price Index (CPI) figures will be out next week.
XAU/USD short-term technical outlook
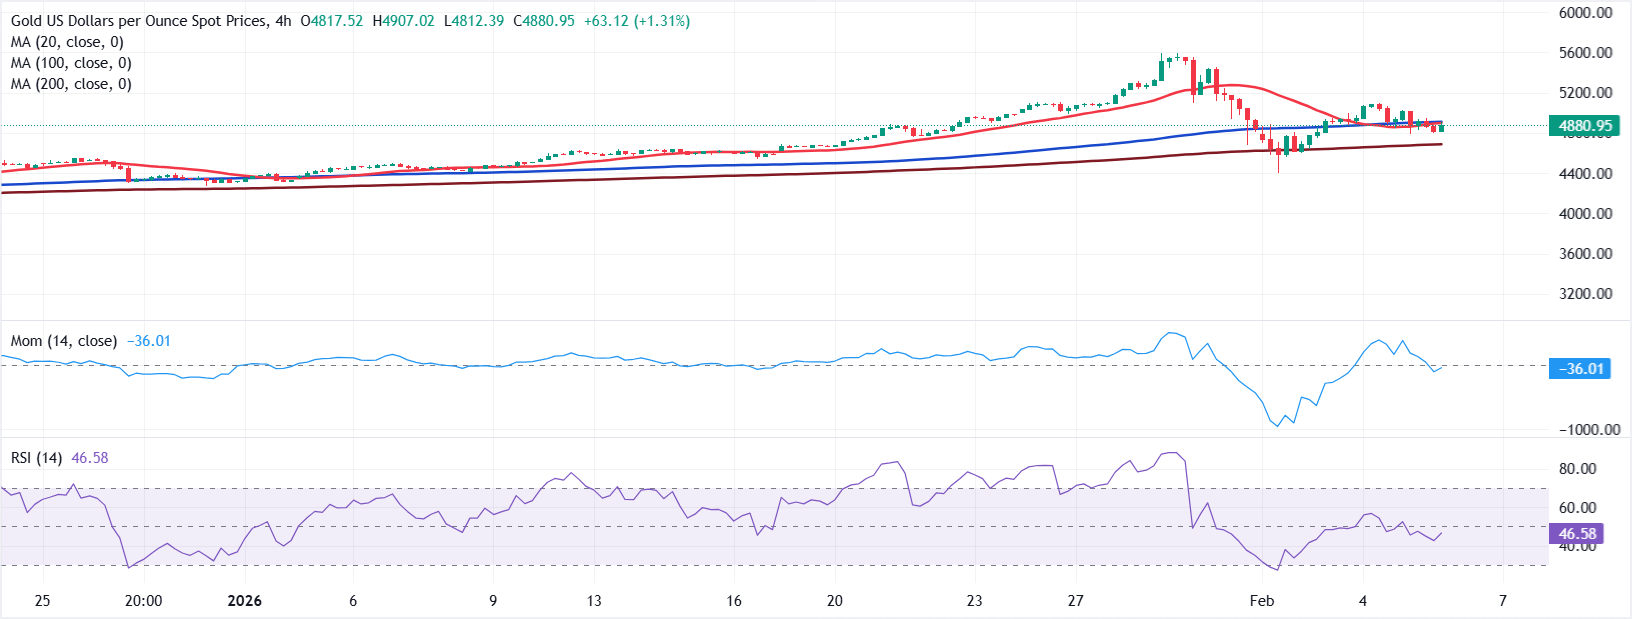
The near-term picture for XAU/USD is bearish. The 4-hour chart shows the 20-period Simple Moving Average (SMA) and the 100-period SMA converging around $4,901, providing near-term resistance. At the same time, a modestly bullish 200-period SMA acts as support at $4,673. The Momentum indicator aims lower around its midline, still neutral, while the Relative Strength Index (RSI) indicator hovers at around 46, lacking clear directional strength yet supporting the bearish case.
In the daily chart, XAU/USD trades above a bullish 20-day SMA, which continues heading higher above the 100- and 200-day ones, limiting the bearish case. The 20-day SMA at $4,846.70 and intraday dips below it continue to attract buyers. Finally, technical indicators hold above their midlines but resumed their declines, reflecting buyers' discouragement.
(The technical analysis of this story was written with the help of an AI tool.)
Premium
You have reached your limit of 3 free articles for this month.
Start your subscription and get access to all our original articles.
Author

Valeria Bednarik
FXStreet
Valeria Bednarik was born and lives in Buenos Aires, Argentina. Her passion for math and numbers pushed her into studying economics in her younger years.


